Relative humidity (RH) is a critical parameter at the heart of modern industrial processes, storage systems, and building management. Across dozens of industries (from pharmaceutical manufacturing to food processing, wood drying to semiconductor production) even a 1% measurement deviation can lead to millions in losses, product spoilage, or regulatory non-compliance.
In this guide, we examine step by step why a humidity measurement system produces errors and how to systematically prevent them. Whether you are a facility engineer, calibration specialist, or procurement manager, this content provides the technical foundation for informed decision-making.
Financial Impact: According to a 2023 European Metrology Institute report, industrial losses from incorrect humidity measurements exceed EUR 4.2 billion per year in the EU for energy inefficiency alone.
Sensor Types and Operating Principles
Five main humidity sensor categories exist on the market. Each operates on a different physical principle and is optimized for specific application conditions. Selecting the wrong type creates a systematic error source regardless of calibration quality.
Capacitive Sensors
Resistive Sensors
Psychrometers
Optical Dew Point Mirrors
Thermal Conductivity Sensors
Sensor Selection Comparison Table
| Sensor Type | Accuracy | Cost | Chemical Resistance | Maintenance | Ideal Application |
|---|---|---|---|---|---|
| Capacitive | ±1.5–3% | Medium | Medium | Annual calibration | HVAC, general industry |
| Resistive | ±2–5% | Low | Medium | Low | HVAC, warehouse monitoring |
| Psychrometer | ±1–2% | Medium | High | High (wick replacement) | Reference measurement |
| Dew Point (optical) | ±0.1°C Td | High | Low | Periodic cleaning | Laboratory, calibration |
| Thermal Conductivity | ±1–3% | High | Very High | Low | Drying ovens, process |
Common Causes of Measurement Errors
Why does a humidity sensor read incorrectly? The answer is directly related to the sensor type, installation method, and maintenance history. Below are the most frequently encountered error sources.
Improper Sensor Selection
Different environments carry vastly different requirements. Choosing a standard capacitive sensor for a paint booth with high chemical vapor load leads to rapid measurement drift and sensor failure. Sensor purchases made without characterizing environmental conditions are the first link in the technical error chain.
Common Mistake: Bulk purchasing the same sensor model for different environments. In areas with chemical vapor, heavy dust, or extreme temperature variations, "general purpose" sensors produce systematic errors.
Calibration Neglect
Capacitive sensors experience 0.5% to 2% RH drift per year depending on operating conditions. This drift is cumulative, a sensor running uncalibrated for 3 years can theoretically produce ±6% error. While most industrial standards (GMP, ISO 14644) mandate periodic calibration, in practice this requirement is often overlooked.
Incorrect Placement
Sensor location is one of the most critical factors affecting measurement accuracy. Common placement errors include:
- Proximity to heat sources: Sensors placed near motors, heaters, or pipe runs read lower RH values due to local temperature effects.
- Proximity to moisture sources: Sensors near steam injectors, wash points, or condensation zones produce systematically high readings.
- Insufficient airflow: Sensors placed in dead zones measure local microclimate rather than actual room humidity.
- Vertical position differences: The RH difference between ceiling and floor can reach 5–15%.
- Sunlight and radiation: Sensors exposed to direct sunlight produce incorrect readings due to temperature effects.
Maintenance and Cleaning Neglect
Dust, oil droplets, or chemical vapors accumulating on the capacitive sensor element surface alter the sensor's moisture absorption capacity:
- Low contamination: ±1–2% RH deviation (correctable by cleaning)
- Medium contamination: ±3–5% RH deviation (calibration required)
- High contamination / chemical damage: Permanent sensor failure
Sensor Aging (Drift)
All sensor types experience accuracy loss over time. In capacitive sensors, this process stems from degradation of the polymer layer's hysteresis properties.
| Environment Severity | Annual Drift | Cumulative Error (5 yr) | Recommended Calibration |
|---|---|---|---|
| Clean, controlled | 0.3 – 0.5% RH/yr | ±1.5–2.5% | Every 2 years |
| Typical industrial | 0.5 – 1% RH/yr | ±2.5–5% | Annually |
| Heavy chemical / humid | 1 – 3% RH/yr | ±5–15% | Every 6 months |
Electromagnetic Interference (EMI)
Sensor outputs exposed to strong electromagnetic fields may contain noise. This effect is particularly pronounced near variable frequency drives (VFDs), large motors, and welding equipment. Solution: shielded cable, grounding, and sufficient distance.
Cable and Connection Issues
Long cable distances, oxidized terminals, incompatible cable cross-sections, or grounding errors lead to signal degradation. Analog (4–20 mA or 0–10 V) output sensors are more susceptible to this error than digital outputs (RS-485, HART).
Consequences of Incorrect Measurement
Energy Inefficiency
HVAC systems consume significant additional energy per percentage point of humidity. If a sensor reads 5% RH above the actual value, the BMS issues unnecessary dehumidification commands:
Cost Example: In a 10,000 m² office building, a humidity sensor operating with +5% RH error results in approximately EUR 8,000–12,000 in excess annual cooling/dehumidification costs. This cost is dozens of times the calibration expense.
Product Quality Issues
- Pharmaceutical production: GMP standards require ±2% tolerance; exceeding this causes batch rejection
- Electronics manufacturing: High humidity in SMT processes causes PCB deformation and soldering defects
- Food processing: Chocolate, biscuits, and powder products are highly humidity-sensitive; incorrect humidity shortens shelf life
- Wood processing: 1% humidity error leads to dimensional rejection due to wood dimensional changes
Legal and Compliance Risks
| Sector | Relevant Standard | Humidity Tolerance | Audit Consequence |
|---|---|---|---|
| Pharma (API production) | GMP Annex 1, EU GMP | ±2% RH | Batch rejection, production halt |
| Cleanroom (semiconductor) | ISO 14644-1 | ±3% RH | Class invalidation |
| Food storage | ISO 22000 | ±5% RH | HACCP plan violation |
| Cultural heritage | ASHRAE 2019 Ch. 24 | ±5% RH | Insurance invalidation |
| Medical devices | ISO 13485 | ±2% RH | FDA 483 finding |
Sensor Selection Guide
Sensor selection should be based on systematic evaluation of four main parameters: measurement range, environmental conditions, accuracy requirements, and budget.
Selection by Temperature Range
| Operating Temperature | Recommended Sensor Type | Note |
|---|---|---|
| -40°C to +60°C | Capacitive (standard) | General industry and HVAC |
| +60°C to +120°C | Capacitive (high temperature) | Ceramic/metal housing required |
| +120°C to +180°C | Thermal conductivity | Drying ovens |
| Below -60°C (dew point) | Optical dew point mirror | Natural gas, cryo applications |
IP Protection Selection
| Environment Type | Minimum IP Class | Example Application |
|---|---|---|
| Indoor, clean office/lab | IP20 | Server room, office |
| Industrial, dusty | IP54 | Production floor, warehouse |
| Wash-down environment | IP65/IP67 | Food processing, paint booth |
| Submersion/condensation | IP68 | Outdoor, cold room entrance |
Accuracy Class Assessment
Calibration: Comprehensive Guide
Calibration is the process of comparing a measurement device's displayed value against a reference standard and correcting if necessary. For humidity sensors, calibration is mandatory both to maintain sensor accuracy and to demonstrate legal/quality compliance.
Sensor Drift Mechanisms
- Polymer layer degradation: Absorption-desorption cycles weaken polymer chains, increasing hysteresis.
- Chemical contamination: VOCs, solvents, or acidic vapors chemically alter the polymer layer.
- Physical contamination: Particle accumulation creates a diffusion barrier, extending response time.
Calibration Methods
a) Saturated Salt Solution Method
Based on the principle that saturated aqueous solutions of specific salts produce a stable and known relative humidity value at controlled temperatures. The most common and economical calibration method.
| Salt | Chemical Formula | RH at 25°C (%) | Application Range |
|---|---|---|---|
| Lithium Chloride | LiCl | 11.3 ± 0.3 | Low humidity calibration (<20%) |
| Magnesium Chloride | MgCl₂ | 32.8 ± 0.2 | Low-medium range |
| Magnesium Nitrate | Mg(NO₃)₂ | 52.9 ± 0.2 | Mid range |
| Sodium Chloride | NaCl | 75.3 ± 0.1 | High humidity (standard) |
| Potassium Sulfate | K₂SO₄ | 97.3 ± 0.5 | Very high humidity |
Important: Salt solution reference values are temperature-dependent. Table values are for 25°C. Calibrations performed at 20°C or 30°C require NIST tables.
b) Comparative (Reference Sensor) Calibration
Comparison of a calibrated reference sensor with the sensor under test in the same environment. Practical for quick field calibration. The reference sensor must have NIST traceability.
c) Laboratory Calibration (NIST Traceable)
Performed in an EN ISO/IEC 17025 accredited laboratory, documented with a calibration certificate. Mandatory for GMP, ISO 13485, and ISO 14644 compliance.
Calibration Frequency: Recommendations by Sector
| Sector / Application | Standard Requirement | NKT Recommendation | Rationale |
|---|---|---|---|
| Pharmaceutical (GMP) | EN ISO/IEC 17025, EU GMP | Every 6 months | Batch quality, audit risk |
| Cleanroom (ISO 14644) | ISO 14644-2 | Every 6 months | Class verification requirement |
| Food processing | ISO 22000 / HACCP | Annually | Hygiene, shelf life |
| Electronics manufacturing | IPC standards | Annually | SMT process assurance |
| HVAC / building management | ASHRAE 62.1 | Every 2 years | Energy optimization |
| Meteorology / research | WMO standards | Every 6 months | Data quality requirement |
| General warehouse / logistics | — | Annually | Insurance and compliance |
Optimal Placement Guide
Airflow Analysis
The humidity sensor must be placed at the point where the air it is expected to represent actually passes. The first step is to create an airflow diagram of the system.
Five-Step Placement Process
- Area Analysis: Create a floor plan of the room or process area. Mark heat sources, moisture sources, and air inlets/outlets.
- Identify Dead Zones: Corners, equipment backs, and ceiling edges are dead zones with weak air circulation. Avoid these locations.
- Apply Distance Rules: Maintain minimum 1 meter from heat sources and minimum 2 meters from moisture sources (steam injectors, wash points).
- Height Selection: For general applications, prefer +1.2m to +1.8m above floor level. For process applications, place the sensor at the center level of the monitored zone.
- Verification Measurement: After installation, perform a comparative measurement with a reference sensor to verify the selected location is representative.
Multi-Sensor Network Design
- Sensor density per area: ISO 14644-1 cleanroom standards define minimum measurement points by room size (e.g., minimum 2 sensors for up to 100 m²).
- Representative points: Critical process zones should be prioritized for sensor placement.
- Redundancy: For critical applications, at least 2 sensors per measurement point is recommended.
Automation and Monitoring Systems
SCADA/BMS Integration
Modern humidity monitoring systems provide real-time data monitoring, trend analysis, and automatic alarm generation through BMS or SCADA integration. Integration protocols: Modbus RTU/TCP, BACnet IP/MSTP, PROFIBUS DP, OPC-UA.
Wireless Sensor Networks
- Battery life: Should be optimized based on measurement frequency (typical: 2–5 years)
- RF dead zones: Metal structures affect signal propagation
- Data security: Use encrypted protocols in industrial environments
Cloud-Based Monitoring
Cloud monitoring platforms offer remote access, automated reporting, and AI-powered anomaly detection. Consider data retention periods and audit trail requirements for regulatory compliance.
Alarm Thresholds and Response Protocols
| Alarm Level | Threshold (Example: Warehouse) | Response Time | Action |
|---|---|---|---|
| Warning | Setpoint ±5% RH | <15 min | Operator notification, log |
| Critical | Setpoint ±10% RH | <5 min | HVAC activation, manager alarm |
| Emergency | Setpoint ±20% RH or sensor failure | Immediate | Process halt, maintenance request |
Best Practice: Set alarm thresholds based on actual limits that affect product or process quality, not arbitrary ±%RH distances from the setpoint. Excessive alarms lead to "alarm fatigue" where operators start ignoring warnings.
Sensors & Controllers
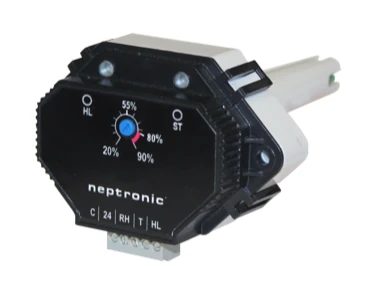
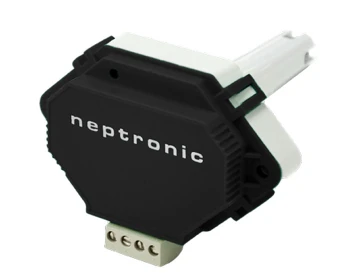
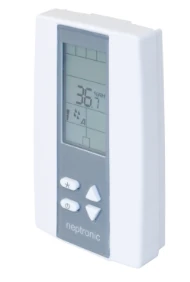
High-accuracy sensors and controllers are critical for correct humidity measurement. Neptronic sensor and controller solutions offered by NKT Humidity Control Technologies:
References
- ASHRAE. (2021). ASHRAE Handbook, Fundamentals, Chapter 36: Measurement and Instruments.
- ISO 14644-2:2015. Cleanrooms and associated controlled environments, Part 2: Monitoring.
- EU GMP Annex 1. (2022). Manufacture of Sterile Medicinal Products. European Commission.
- NIST Special Publication 250-83. (2016). Calibration of Hygrometers with the Hybrid Humidity Generator.
- Wiederhold, P. R. (1997). Water Vapor Measurement: Methods and Instrumentation. Marcel Dekker.
- WMO Guide to Instruments and Methods of Observation. (2018). WMO-No. 8, Chapter 4.
- ISO/IEC 17025:2017. General requirements for the competence of testing and calibration laboratories.
- ISO 22000:2018. Food safety management systems, Requirements for any organization in the food chain.