The Importance of Industrial Humidity Control: A Decision Guide for Production Managers
For most production managers, humidification is treated as a "by-product of the HVAC system" and is pushed to the bottom of the budget conversation. Yet across Türkiye's geography, indoor relative humidity (RH) falls into the 20–30% band for roughly five months between October and March; during this period production efficiency drops, product quality drifts, employee absenteeism climbs, and energy consumption silently rises. This guide explains, through three core topics — static electricity, moisture stability, and health & comfort — why industrial humidification is not an "added cost" but rather a measurable, return-bearing investment. It is designed as a decision guide that production managers can put to work directly. As NKT — Nem Kontrol Teknolojileri, we summarise here the 25+ years of industrial field experience and our technology partnership with Neptronic Canada, drawing on projects we have executed in print rooms, textile plants, hospitals, museums, food facilities, and data centers.
Three Core Problems Caused by Low Relative Humidity
Three main headings form the economic rationale for an industrial humidification investment: static electricity (direct effect on production efficiency and product quality), moisture stability (dimensional, textural, and weight stability of hygroscopic materials), and health & comfort (employee absenteeism, IAQ complaints, and heating cost). Each of these can independently prove the return on a humidification investment; together they push the payback period into the 12–24 month range. The three callout cards below summarise the business impact of each heading at a glance.
Loss of efficiency and safety: paper sticking in print rooms, yarn breakage in textile, PCB failure in electronics, flammable-gas sparks in operating rooms. ESD risk rises dramatically below 35% RH.
Product quality: cotton, paper, wood, tobacco, leather all equilibrate with ambient air (hygroscopic regain). RH fluctuation = drift in size, texture, weight.
Employee productivity: mucosal irritation, virus susceptibility, absenteeism. RH 20→30% transition reduces absenteeism by 15%; comfort thermostat can be lowered by 1–2°C.
In the sections below we examine each heading in detail, covering sector-specific effects and the parameters production managers should weigh when making a decision. For computation, our Psychrometric Calculator tool is available.
Static Electricity and Production Efficiency
Static electricity arises from electron exchange when two surfaces rub against each other. The intensity of this phenomenon is directly affected by air humidity: humid air, owing to its water molecules, allows electron transfer to dissipate over a surface, and the electrical charge bleeds off gradually. In dry air, however, charge accumulates on the surface and discharges directly onto a metallic object or operator — this both reduces production efficiency and causes failures in sensitive electronic components (PCB, sensor, chip). The widely accepted critical threshold in industry is 35% RH; below this value, static-related complaints rise exponentially.

Sector-Specific Impact Table
The economic impact of static electricity on production varies by sector. The table below summarises observations recorded by NKT — Nem Kontrol Teknolojileri field teams alongside the joint dataset from international engineering literature.
| Sector | Static-Electricity Effect | Typical Efficiency Loss |
|---|---|---|
| Printing & Press | Paper sticking, feed jams, high-speed press stoppages, ink misting | 20%+ production speed loss |
| Textile (Cotton, Synthetic) | Yarn adhesion, shuttle slip, weave-pattern defects, fiber breakage | 2–4 hrs/day downtime per line |
| Office & Photocopying | Photocopier jams, print scatter, static-shock complaints | Increase in service call volume |
| Computer Room & Data Center | PCB failure, tape-drive breakage, sensor noise, reset errors | 10,000+ USD/event ESD damage |
| Hospital Operating Room | Flammable anesthetic gas + static spark = explosion risk (critical & life-threatening) | Patient safety — zero tolerance |
| Electronics Assembly (SMT) | Chip ESD damage, sensor failure, calibration drift | Drop in lot acceptance rate |
For deeper coverage of static electricity, see our ESD (Electrostatic Discharge) and static electricity glossary entries. In sensitive electronics production environments, mapping ESD risk and setting the humidification setpoint in the 40–50% RH band is the standard recommendation of the NKT engineering team.
Moisture Stability: The Silent Determinant of Product Quality
Hygroscopic (water-attracting) and fibrous materials — cotton, wool, paper, wood, tobacco, leather, gelatin, starch — equilibrate dynamically with ambient moisture. A change in ambient humidity directly changes the material's moisture content by mass: it absorbs or releases water — resulting in shifts in dimension, texture, weight, and mechanical properties. In engineering literature this phenomenon is called hygroscopic regain. When the ambient relative humidity is held at a given value, the material absorbs the corresponding equilibrium moisture percentage.
What Does the Loss Mean?
Hygroscopic regain is not an abstract engineering concept; it shows up directly as a gain/loss line item in the operations ledger. Let us make it concrete with a few practical examples:
- Tobacco: A transition from 5% RH to 50% RH means 11–16% mass gain for cigarette tobacco. The number of cigarettes that can be produced from the same quantity of tobacco varies by this margin; when production is run in low-RH conditions, the operation loses 110–160 kg of saleable product per ton of tobacco.
- Cotton (American): Moving from 9% RH to 50% RH lifts regain from 3% to 7%; this corresponds to roughly 4% mass gain. Moisture content is a pricing parameter in cotton trade.
- Wood (lumber): A rise from 30% to 60% RH causes a 2–3% dimensional expansion. For a furniture manufacturer this translates directly into assembly defects, sticking doors and drawers.
- Paper: Printing paper regain rises from 5% to 7% as RH moves from 30% to 50%. This shift disturbs the paper's dimensional stability — the root cause of register drift, curl, and wrinkle complaints.
- Leather: Hardens and cracks at 30% RH; becomes pliable at 70% RH. In tanning and leather garment production, the RH band should be fixed at 50–55%.
Typical Equilibrium Ranges for Türkiye Industry
The table below summarises typical design humidity ranges for the most common hygroscopic materials encountered in Turkish industry, derived from ASHRAE fundamentals. For detailed sector-specific design conditions see the ASHRAE Table 4 reference in our Humidification Load Calculation guide.
| Sector / Material | Typical RH Band | Design Temperature |
|---|---|---|
| Textile — Cotton Weaving | 60–65% | 24°C |
| Textile — Cotton Combing | 50–60% | 22°C |
| Printing — Press Room | 45% | 24°C |
| Paper Warehouse | 50% | 24°C |
| Tobacco — Cigarette Processing | 60–70% | 24°C |
| Furniture — Woodworking | 40–45% | 20°C |
| Museum, Archive, Library | 50–55% | 21°C |
| Food Storage (Dry) | 50–55% | 15–20°C |
| Leather Tanning | 50–55% | 22°C |
Hygroscopic Regain: Reference Table
The table below is the most frequently referenced hygroscopic regain dataset in industrial engineering literature (based on the ASHRAE Handbook and Carrier System Design), reorganised by NKT engineering. Percentages express moisture as a fraction of dry weight: at a given RH equilibrium, what percentage of the material's dry mass is water? This table is the fundamental reference for setting an ambient RH setpoint in product quality control. Our hygroscopic regain glossary entry defines the concept in detail.
Hygroscopic Regain of Common Industrial Materials (at % RH)
| Sector / Material | 10% | 20% | 30% | 40% | 50% | 60% | 70% | 80% | 90% |
|---|---|---|---|---|---|---|---|---|---|
| Bakery / Confectionery | |||||||||
| Cracker | 2.1 | 2.8 | 3.3 | 3.9 | 5.0 | 6.3 | 8.2 | 10.9 | 14.9 |
| Flour (White Wheat) | 2.6 | 4.1 | 5.3 | 6.5 | 8.0 | 9.9 | 12.4 | 15.4 | 19.1 |
| White Bread | 0.5 | 1.7 | 3.1 | 4.5 | 6.2 | 8.5 | 11.1 | 14.5 | 19.0 |
| Leather | |||||||||
| Sole Oak Tanned | 5.0 | 8.5 | 11.2 | 13.6 | 16.0 | 18.3 | 20.6 | 24.0 | 29.2 |
| Printing / Paper | |||||||||
| Comm. Ledger 75% Rag/1% Ash | 2.4 | 3.7 | 4.7 | 5.5 | 6.5 | 7.5 | 8.8 | 10.8 | 13.2 |
| Newsprint (24% Ash) | 2.1 | 3.2 | 4.2 | 5.3 | 6.2 | 7.2 | 8.3 | 9.9 | 11.9 |
| White Bond Rag (1% Ash) | 2.4 | 3.7 | 4.7 | 5.5 | 6.5 | 7.5 | 8.8 | 10.8 | 13.2 |
| Writing Paper (3% Ash) | 3.2 | 4.2 | 5.0 | 5.9 | 6.8 | 8.2 | 9.9 | 11.8 | 14.2 |
| Textile | |||||||||
| Cotton — Absorbent | 4.8 | 9.0 | 12.5 | 15.7 | 18.5 | 20.8 | 22.8 | 24.3 | 25.8 |
| Cotton — American | 2.6 | 3.7 | 4.4 | 5.2 | 5.9 | 6.8 | 8.1 | 10.0 | 14.3 |
| Cotton — Sea Isle | 2.4 | 3.5 | 4.3 | 5.1 | 5.8 | 6.8 | 8.2 | 10.3 | 14.1 |
| Hemp — Manila / Sisal | 4.9 | 7.8 | 9.9 | 11.5 | 13.1 | 14.9 | 17.2 | 20.2 | 24.1 |
| Jute | 3.1 | 5.4 | 7.7 | 9.7 | 11.4 | 13.1 | 15.2 | 17.8 | 20.2 |
| Linen — Dry Spun | 1.9 | 2.9 | 3.6 | 4.3 | 5.1 | 6.1 | 7.0 | 8.4 | 10.2 |
| Rayon — Acetate / Filament | 0.8 | 1.1 | 1.4 | 2.3 | 2.8 | 3.4 | 4.1 | 5.3 | 7.3 |
| Rayon — Cupramonium | 1.8 | 3.3 | 4.8 | 6.7 | 8.8 | 10.9 | 12.9 | 15.8 | 19.5 |
| Rayon — Viscose | 2.8 | 4.0 | 5.7 | 6.9 | 8.1 | 10.0 | 11.9 | 14.3 | 18.8 |
| Silk — Raw Chevennes-Skein | 3.2 | 5.5 | 6.9 | 8.0 | 8.9 | 10.2 | 11.9 | 14.3 | 18.3 |
| Wool — Australian / Merino-Skein | 4.7 | 7.0 | 8.9 | 10.8 | 12.8 | 14.9 | 17.2 | 19.9 | 23.4 |
| Tobacco | |||||||||
| Cigarette | 5.4 | 8.6 | 11.5 | 14.3 | 16.8 | 19.8 | 23.5 | 28.5 | 34.5 |
| Wood | |||||||||
| Lumber — Average | 2.3 | 4.7 | 6.8 | 9.1 | 11.4 | 13.7 | 16.5 | 19.9 | 23.7 |
| Glue — Hide | 3.4 | 4.8 | 6.6 | 8.3 | 10.5 | 12.5 | 14.2 | 16.2 | 19.0 |
| Miscellaneous | |||||||||
| Activated Carbon — Steam | 7.1 | 14.3 | 22.8 | 26.2 | 28.3 | 29.2 | 30.0 | 31.1 | 32.7 |
| Gelatin | 2.8 | 4.9 | 6.6 | 8.1 | 9.5 | 11.4 | 13.2 | 15.2 | 17.8 |
| Silica Gel | 5.7 | 9.8 | 12.7 | 15.2 | 17.2 | 18.8 | 20.2 | 21.5 | 22.2 |
| Soap | 1.9 | 3.8 | 5.7 | 7.6 | 10.0 | 12.9 | 16.1 | 19.8 | 23.8 |
| Starch | 2.2 | 3.8 | 5.2 | 6.4 | 7.4 | 8.3 | 9.2 | 10.6 | 12.7 |
Note: Moisture percentage based on dry weight, ambient temperature 22°C. Source: Derived from ASHRAE Handbook and Carrier System Design datasets by the NKT engineering team.
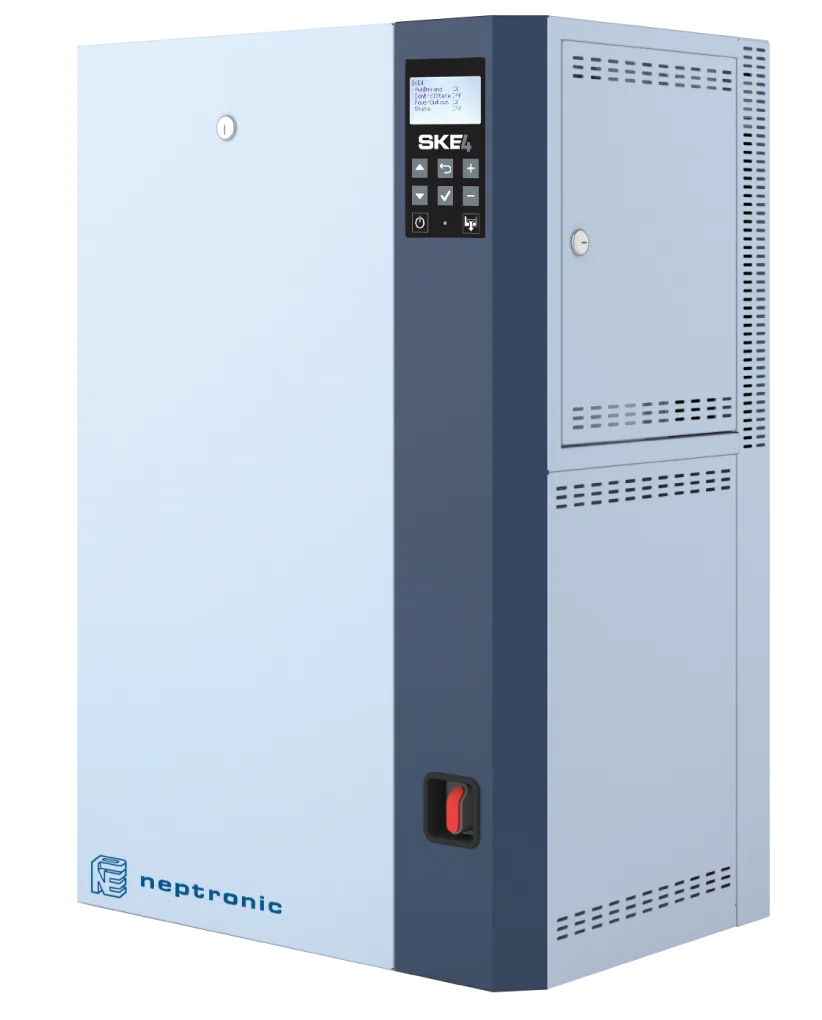
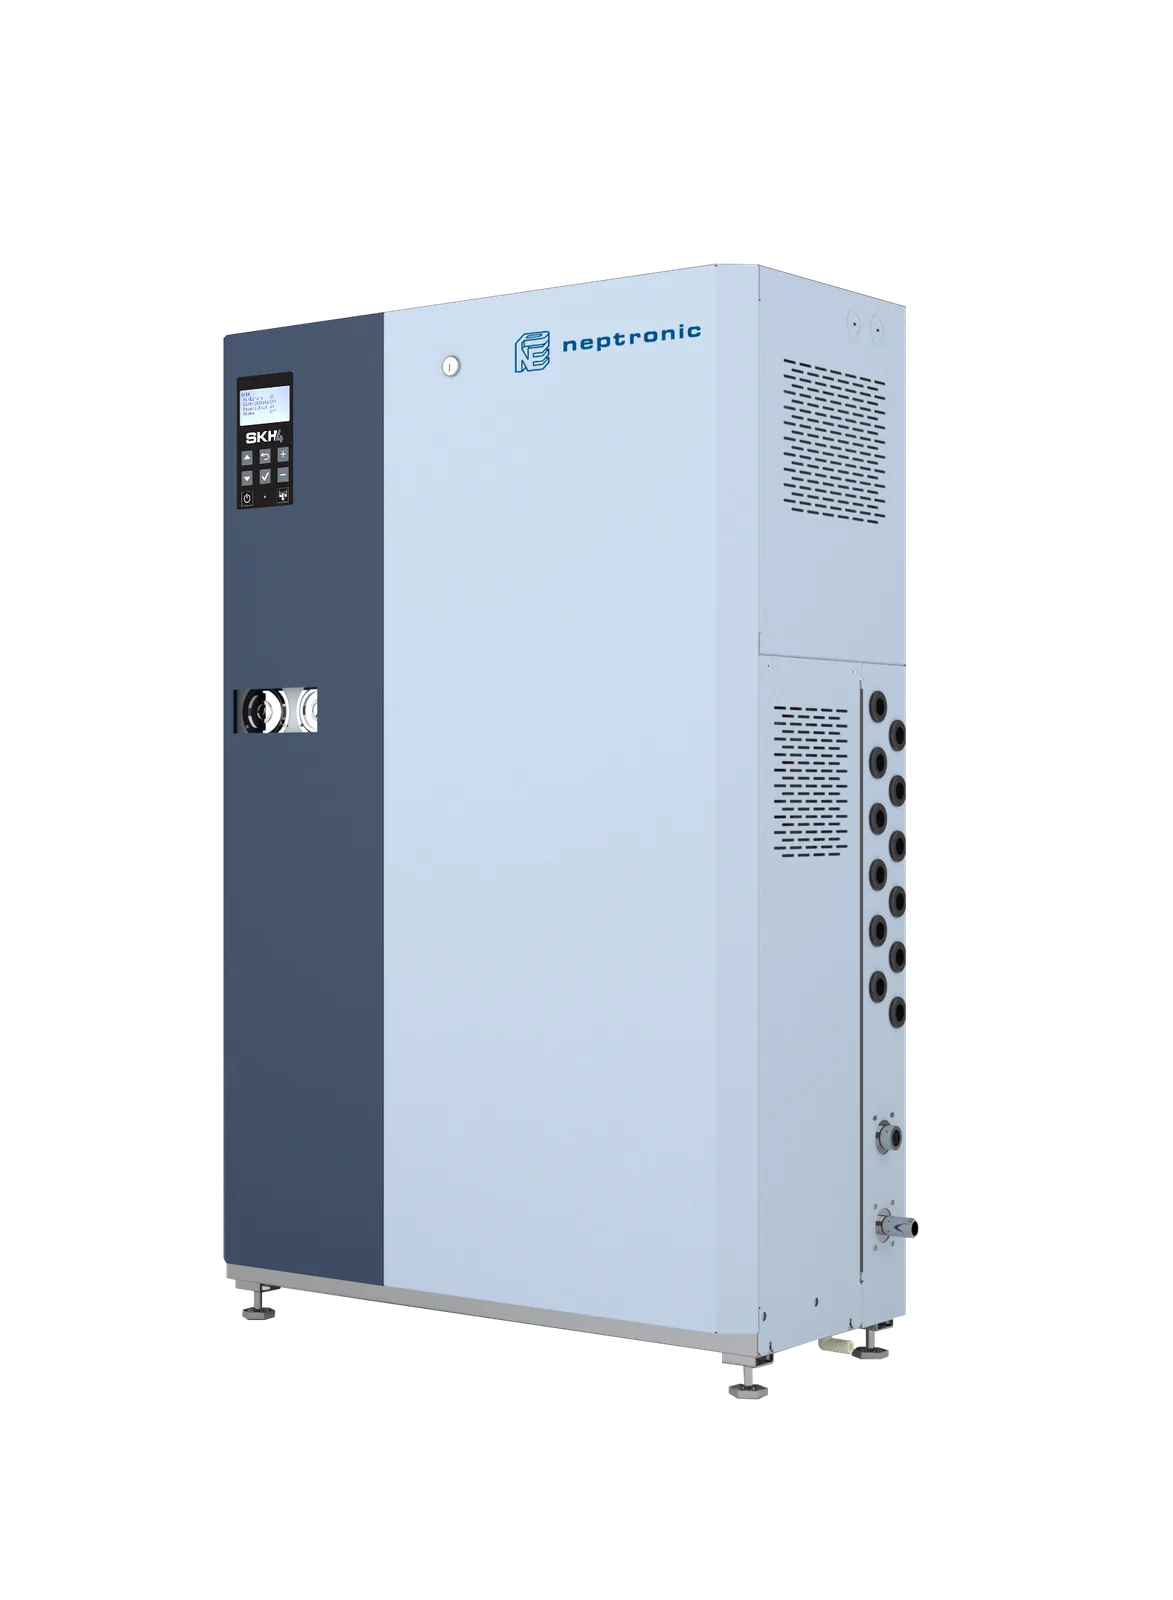
When working with the hygroscopic regain table, do not neglect the band width (±% RH). Targeting 50% ± 2% RH demands very different equipment accuracy and control strategy than 50% ± 5% RH. For applications requiring tight control, the Neptronic SKE4 / SKS4 family (±1% RH) is preferred; for comfort applications, Neptronic SKH atomization (±3–5% RH) is selected.
Health & Comfort: The Non-Obvious Dimension of Employee Productivity
When production efficiency is discussed, machines come to mind first; yet one of the most critical factors shaping production rate in the field is employee health and comfort. In winter, the heating system pushes indoor relative humidity below 20%. Such dry air triggers a series of adverse effects in the human body: drying of the upper-respiratory mucosa, eye irritation, skin cracking, static-shock complaints, headaches, and general fatigue. More critically, dry air extends the suspension time of viruses and bacteria; it lowers mucosal defence capacity. The result: a rise in sickness frequency, an increase in absenteeism, and a silent loss of production capacity.

Absenteeism and Cost
The classic study by Dr. George Green of the University of Saskatchewan showed that raising relative humidity from 20% to 30% reduced employee absenteeism by approximately 15% in an office environment. Translated to Turkish industrial conditions, that corresponds to 30–40 workdays recovered per season for a 100-person shift. The direct cost of a lost workday (wage + insurance + lost throughput) typically sits between 800 and 1,500 TL across sectors; a simple arithmetic shows that the humidification investment can amortise itself on absenteeism reduction alone.
Indoor Air Quality (IAQ)
Indoor Air Quality (IAQ) complaint analyses show that roughly 75% of complaints are comfort-driven: air feeling too dry, too humid, too warm, or too cold. The majority can be resolved with correct humidity control. ASHRAE 55 defines an upper bound of 60% RH and a lower bound of 30% RH for human comfort. The 30–50% RH band is the optimal range from comfort, microbiology, and electrostatic standpoints alike:
- Bacteria: Most bacteria show minimum proliferation in the 30–60% RH band.
- Virus: Influenza and respiratory viruses stay viable far longer in dry air (below 20%); inactivation accelerates in the 40–60% band.
- Fungi / Mould: Growth rises dramatically above 60% RH; a 30% RH floor reduces mould risk to zero.
- Dust mites: Population grows above 50% RH; below 50% it remains controlled.
- Respiratory tract issues: Asthma, allergy, and COPD complaints are minimised in the 30–50% band.
Comfort Thermostat: Silent Energy Saving
A frequently overlooked fact: humid air feels warmer. At the same measured temperature, the humid environment is perceived 1–2°C warmer than the dry one. This means that, once humidification is in service, the heating thermostat can be lowered by 1–2°C. Validated by ASHRAE 55 and the international HVAC engineering literature, this strategy reduces heating costs by 5–10%. The humidification investment therefore contributes not only to comfort but also positively to the energy budget.
Sector-Specific Impacts and Economic Costs
The economic cost of low relative humidity is realised through a different mechanism in each sector. The table below summarises typical cost ranges, distilled from NKT — Nem Kontrol Teknolojileri field records and international industry reports. These numbers are not negotiating chips or quote figures — they are loss levels actually measured in the field.
| Sector | Mechanism of Low RH | Measurable Cost |
|---|---|---|
| Printing | Active paper waste (curl + register + static), press re-runs, ink misting | 5–12% waste (paper + print) |
| Textile (Yarn / Weaving) | Yarn breakage, static-shock downtime, shuttle slip, fiber dusting | 2–4 hrs/day production loss per line |
| Data Center / Computer Room | ESD product failure, sensor noise, reset errors, tape-drive damage | 10,000+ USD/event ESD loss |
| Hospital (HAI) | Airborne infection transfer (mucosal defence drop, virus viability) | 15–25% HAI rise (RH<30%) |
| Museum & Archive | Wood cracking, paper disintegration, paint flaking, leather drying | Millions of TL in future restoration |
| Food Storage (Fruit-Vegetable) | Evaporation-driven weight loss, surface shrivelling, sales loss | 5–10% weight loss |
| Furniture / Wood | Lumber dimensional drift, assembly defects, door/drawer sticking, returns | 3–5% assembly return rate |
| Tobacco Processing | Dry-tobacco weight loss, loss of elasticity, cigarette-machine speed loss | 11–16% mass loss (RH 5%→50%) |
| Pharmaceutical | Tablet cracking, coating failure, capsule electrostatic charge | Drop in lot acceptance rate |
Mini Case Study: Bursa Print Room
Investment and Return Calculation
An industrial humidification investment fits a classical CAPEX + OPEX model. The cost and return line items below are typical mid-size values curated by NKT — Nem Kontrol Teknolojileri from its nationwide Turkish project portfolio. For each facility, a detailed analysis is delivered in an individual report following an NKT engineering site visit.
Cost Items (Typical Mid-Size, 5–50 kg/hr)
- Equipment CAPEX: 50,000–250,000 TL (varies by capacity and technology — resistive, gas-fired, atomization).
- Installation + Mechanical: 15–30% of CAPEX (steam distribution piping, water softening, electrical installation, control wiring).
- Water & Energy OPEX:
- Resistive steam (SKE4): roughly 0.75 kWh/kg of steam, accurate modulation, independent of water quality.
- Adiabatic atomization (SKH): roughly 0.07 kWh/kg — uses ambient thermal load for latent heat (free cooling advantage up to 12°C).
- Maintenance: 8,000–25,000 TL/year (included in the Neptronic standard package; periodic filter, water-level sensor check, UV lamp replacement).
For a detailed OPEX comparison and 10-year TCO (Total Cost of Ownership), the TCO table in our Electrode vs. Resistive Comparison guide is available.
Return Items (Typical Mid-Size Print Room)
- Waste Reduction: 250,000 TL/year (paper + print + ink).
- Employee Productivity: 80,000 TL/year (reduced absenteeism + fewer static-shock complaints).
- Comfort Energy Savings: 30,000 TL/year (heating thermostat lowered by 1–2°C).
- Maintenance / Service Call Reduction: 15,000 TL/year (static-related press machine jams).
ROI (%) = (Annual Savings − Annual OPEX) / Total CAPEX × 100
// Example: Bursa Printing
Annual Savings = 430,000 TL
Annual OPEX (energy + water + maintenance) = 60,000 TL
Total CAPEX (equipment + installation) = 380,000 TL
Net Annual Gain = 370,000 TL
Payback = 380,000 / 370,000 ≈ 12.3 months
Typical ROI band lands at 12–24 months. For applications requiring a tight RH band (pharma, hospital, museum), the payback may extend to 18–30 months; in those settings humidification ceases to be an investment decision and becomes a regulatory obligation (GMP, ASHRAE 170).
Which Equipment Type Suits Your Application?
Correct equipment selection depends on application type, capacity, water quality, hygienic requirements, control accuracy, and energy-source preference. NKT — Nem Kontrol Teknolojileri's most commonly recommended decision tree is summarised below:
- Hygiene-critical (hospital, pharma, food): Neptronic SKE4 + clean steam with DI/RO water or SKS4 (steam-to-steam heat exchanger). Mineral-free, odourless, sterile steam.
- High capacity, natural gas preference: Neptronic SKG4 (gas-fired steam). 50–400 kg/hr modular capacity, outdoor installation option.
- Low energy + free cooling, textile/print: Neptronic SKH (high-pressure atomization, RO water). Adiabatic cooling up to 12°C; minimum 1.5–7.5 kW.
- Comfort / standard industrial: Neptronic SKE4 (resistive steam). DI / RO / hard mains water compatible, ±1% RH accuracy.
Recommended Solution 1: Neptronic SKE4 (Resistive Steam)
For most comfort and tight-RH applications, our first choice is the SKE4 family. It produces mineral-free, odourless, sterile steam; the long-life stainless-steel evaporation chamber (no cylinder replacement needed), ±1% RH accuracy, and BACnet/Modbus BMS integration cover a wide application set. Its 2.7–136 kg/hr modular capacity range spans from small offices to large industrial facilities.
Recommended Solution 2: Neptronic SKH (High-Pressure Atomization)
Where high airflow applications — textile, print, woodworking, greenhouse, wine cellar — meet a hard energy-budget constraint, the SKH family stands out. Adiabatic evaporation draws the latent heat from ambient air — thereby providing free cooling up to 12°C. With a 1.5–7.5 kW motor range covering 30–2,108 kg/hr capacity, it delivers up to 90% energy savings compared with resistive systems. Silver-ion antibacterial technology and VDI 6022 hygiene compliance guarantee quality.
Decision Making: Where to Start?
Approaching the industrial humidification investment decision as a four-step process delivers both technical correctness and economic transparency. This sequence is a roadmap your facility team can follow on its own, before meeting our field engineers in person.
Step 1: Measure Current RH
Through the winter season, record temperature and relative humidity once per shift (morning / mid-day / night). 3–7 days of data are sufficient. These records reveal the real profile of your current indoor conditions. An entry-level RH/temperature logger (a home-grade data logger costs 500–1,500 TL) is adequate. When measuring, keep the device away from ventilation outlets, exterior doors, and heat sources.
Step 2: Define Sector-Target RH
From the design conditions table in Section 3, or for finer-grained sector records the ASHRAE Table 4 adaptation in our Humidification Load Calculation guide, identify the target RH band suited to your sector. It is important to define the band width (±% RH) together with the single setpoint, rather than the setpoint alone. The gap between target RH and your measurement is the rough indicator of your humidification load.
Step 3: Load Calculation
Hourly humidification load (kg/hr) is computed from facility volume, air-change rate, and outdoor air conditions. At this step you can use our Humidification Load Calculator and Psychrometric Calculator tools. If you would rather not work through the math, our NKT Pro mobile app performs the entire calculation automatically from your site data; it embeds ASHRAE Climatic Design Conditions and TS 825 datasets.
Step 4: NKT Engineering Site Visit
The appointment with our field team is scheduled after you have completed the three steps above. The visit includes a building pressure test, blower-door, fan-flow calibration, current RH/temperature logger measurements, and usage-profile analysis. The output is a detailed engineering report, equipment recommendation, and return analysis delivered to your team.
The NKT Engineering Solution Approach
NKT — Nem Kontrol Teknolojileri is the engineering company serving the industrial humidity-control segment in Türkiye with 25+ years of accumulated experience. Instead of delivering a single-point quote, we provide a full-package solution that includes site analysis, design, equipment selection, installation, commissioning, training, and periodic maintenance. Through our technology partnership with Canada-based Neptronic (Türkiye's official distributor), we operate a broad product and expertise portfolio.
NKT Engineering Services
- Site Analysis and Measurement: Building pressure test, blower-door, CO&sub2; tracking, recording of existing RH/temperature profiles — derivation of real ACH and leakage maps.
- Psychrometric Calculation and System Design: Detailed load calculation referenced to ASHRAE Table 4 and TS 825, equipment sizing, control-strategy design, BMS integration plan.
- Equipment Selection and Supply: Selection of the most suitable configuration from the Neptronic SKE4, SKS4, SKG4, SKH product family; local stock and fast delivery.
- Installation & Commissioning: On-site PV (Performance Validation) tests, RH/temperature logger measurements, control-parameter optimization, operator training.
- Periodic Maintenance and 24/7 Service: A field-engineer network across every region of Türkiye, spare-parts inventory, remote monitoring and tele-service.
Rapid Calculation and Decision Tools
NKT's web-based free engineering tools allow production managers to perform preliminary analysis on their own:
- Psychrometric Calculator — From temperature + RH inputs, computes dew point, absolute humidity, enthalpy, and wet-bulb.
- Humidification Load Calculator — Facility volume + ACH + outdoor air data produces hourly load (kg/hr) output.
- Air Mixing Calculator — For mixed-air system design, computes the return-air + fresh-air mixing condition.
- NKT Pro mobile app — Free on iOS and Android; site equipment selection, load calculation, customer PDF report generation; works offline.
Closing
Industrial relative-humidity control must occupy a place on a production manager's agenda not as a "by-product" but as a measurable, return-bearing strategic investment. Static-electricity-driven efficiency loss, hygroscopic material stability, and employee health & comfort form three independent economic rationales; when assessed together, a typical payback period materialises in the 12–24 month band. This guide was written to summarise the fundamental data that can trigger the decision and the field experience of NKT — Nem Kontrol Teknolojileri. For a facility-specific preliminary analysis you can start with the NKT Pro mobile app; for an on-site visit and detailed engineering report you can request an expert consultation.
For more information, visit our NKT Akademi homepage for the rest of our guides on psychrometrics, humidity control engineering, and sector-specific applications.