
When selecting an industrial dehumidifier (whether for the tight tolerance of a production process or for shelf-level dew-point control in cold storage) the starting point is always a moisture load calculation. Without an accurate calculation, the chosen industrial dehumidifier will either fail to reach the target humidity or, being oversized, will short-cycle continuously and waste energy. As NKT, Humidity Control Technologies, we represent TFT Italy's industrial dehumidifier portfolio in Türkiye; on each project we run site survey + moisture load calculation + TFT unit selection together. This guide first explains humidity concepts from scratch, then shows the seven sources that create moisture load in a space with practical formulas and worked examples, and finally covers how to make the capacity selection and equipment-type decision.
Insufficient capacity fails to maintain target humidity; mould growth, structural corrosion and quality loss follow. Excess capacity causes continuous short-cycling; compressor life shortens by 30–50% and annual energy consumption rises unnecessarily. The ideal device is a modulating system that meets the peak moisture load with a 20% safety margin.
What Is Humidity, How Is It Measured?
Humidity is the amount of water vapour in air. Water is one of the basic atmospheric components; its amount changes with temperature, pressure and environmental conditions. Air absorbs water vapour like a sponge absorbs water, but the capacity of this sponge is a temperature-dependent property. This simple but important fact explains why four different parameters exist.
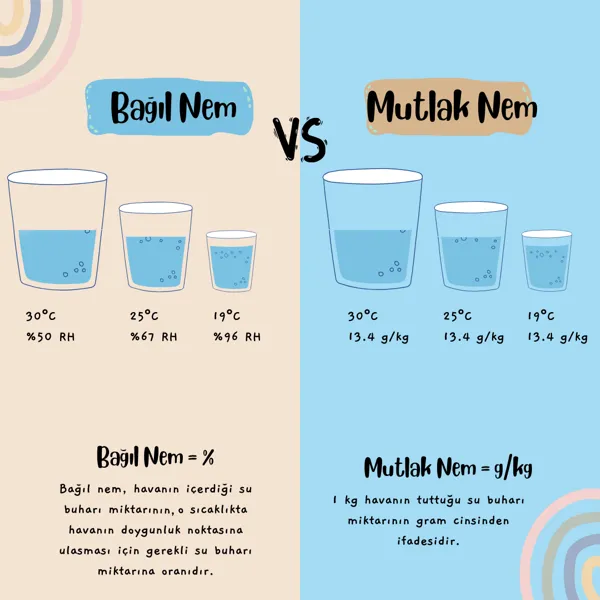
What Is Relative Humidity (RH)?
Relative humidity (RH) is the percentage ratio of the amount of water vapour in the air to the maximum amount of water vapour the air can hold at that temperature. 0% indicates completely dry air; 100% indicates saturated air (at the condensation threshold).
Pv = partial pressure of water vapour in air (Pa)
Psat = saturated vapour pressure at the same temperature (Pa)
RH = relative humidity (%)
Relative humidity is the most commonly used parameter in home/office comfort thermostats, weather reports and human-health standards. ASHRAE and WHO recommend the 40–60% RH band for human comfort; this band minimises both respiratory infections and mould risk.
Important detail: RH is strongly temperature-dependent. The RH value of an air mass containing the same amount of water changes significantly when temperature changes. As a rule of thumb, a 1°C temperature rise at room conditions corresponds to roughly a 3% drop in RH.
On a winter morning outdoor air may be 5°C at 85% RH. When this air is brought into a home and heated to 22°C, although absolute humidity remains unchanged, relative humidity drops to approximately 26%. Occupants experience mucosal irritation, static electricity, cracking in wooden floors. The solution is to integrate a humidification system alongside the heating.
Temperature ↔ Relative Humidity ↔ Absolute Humidity
Container = air's moisture-holding capacity (temperature-dependent). Water level = relative humidity (%). Water amount = absolute humidity (g/m³).
What Is Absolute Humidity?
Absolute humidity (ρv) is the total mass of water vapour an air mass carries per unit volume. Its unit is g/m³ or kg/m³. Unlike relative humidity it is not temperature-dependent: the same value of 12 g/m³ represents the actual amount of water in the volume whether the air is at 5°C or 25°C.
ρv = absolute humidity (g/m³)
mv = mass of water vapour in air (g)
Vtotal = total air volume (m³)
Typical reference values: at 20°C, saturated air carries approximately 17.3 g/m³; at 30°C, about 30.4 g/m³; at 5°C, only 6.8 g/m³ of water vapour. The moisture-carrying capacity of air grows exponentially with temperature, this is the fundamental reason why moisture load increases so dramatically in summer.
A 1000 m³ food storage warehouse: outdoor design 30°C, 75% RH (~22.8 g/m³ absolute humidity); indoor target 18°C, 50% RH (~7.7 g/m³). Assuming 1 air change per hour (1 ACH), additional moisture load entering the warehouse per hour is:
(22.8 − 7.7) g/m³ × 1000 m³/h = 15.1 kg/h
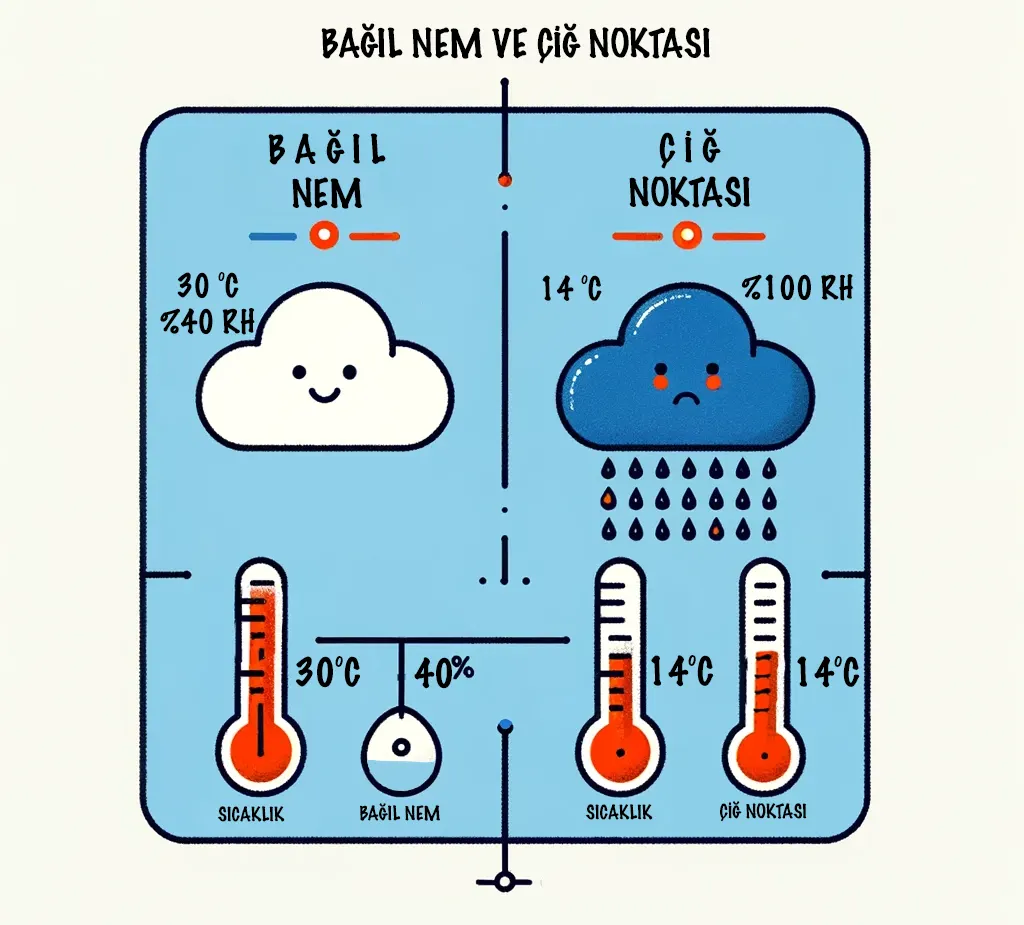
What Is Dew Point?
Dew Point (Tdp) is the temperature at which air, cooled at constant pressure, reaches saturation (RH = 100%) and water vapour begins to condense. It is expressed in °Cdp.
Dew point is a single-variable, direct indicator of the absolute moisture content of air. As long as temperature or pressure does not change, dew point remains constant; this is why dew point measurement is preferred over relative humidity in process control. A lower dew point corresponds to lower relative humidity at the same temperature.
| Application | Typical Dew Point Target | Why This Value? |
|---|---|---|
| Comfort air conditioning | +5 ↔ +12°Cdp | Human comfort, no mould risk |
| Cold storage | −5 ↔ −15°Cdp | No surface condensation, less defrost |
| Pharmaceutical granulation | −20 ↔ −40°Cdp | Hygroscopic materials protected from moisture uptake |
| Lithium battery dry room | −40 ↔ −60°Cdp | Mandatory to prevent Li + H₂O reaction |
Condensing-type dehumidifiers can practically reach down to +12°Cdp. Below this limit, silica gel rotor desiccant systems are required; these can reach down to −60°Cdp.
What Is Specific Humidity (W)?
Specific humidity (W or x) is the ratio of water vapour mass in air to the dry air component of that same air. Its unit is g water vapour / kg dry air. Also called "humidity ratio" in thermodynamic literature, it is the standard y-axis of psychrometric charts.
W = specific humidity (kg water vapour / kg dry air)
Pv = partial pressure of water vapour (Pa)
Patm = atmospheric pressure (≈ 101,325 Pa, at sea level)
0.622 = molecular mass ratio (Mv/Mda)
The most important property of specific humidity is that it remains constant when air is only heated or cooled (without phase change). Therefore W does not change at a heating coil; at a cooling coil, when air falls below its dew point, W drops (through condensation). Because all moisture load calculations are done via mass balance, W is the standard parameter.
| Parameter | Unit | Temperature Independent? | Most Used For |
|---|---|---|---|
| Relative Humidity (RH) | % | No | Comfort + human-health setpoint |
| Absolute Humidity (ρv) | g/m³ | Yes | Seasonal comparison, outdoor air analysis |
| Dew Point (Tdp) | °C | Yes | Low-humidity process control |
| Specific Humidity (W) | g/kg dry air | Yes | All load formulas (engineering standard) |
The Seven Sources of Moisture Load
Moisture load in a space comes not from a single source but from seven independent mechanisms. For accurate equipment selection, each must be calculated separately and summed.
| Source | Mechanism | Typical Share |
|---|---|---|
| Unintended ventilation (infiltration) | Outdoor air leaking through cracks, doors, conveyors, airlocks | 30–60% |
| Intentional ventilation (mechanical supply) | Fresh air supplied per requirement (m³/h per person) | 10–25% |
| Water evaporation | Open water surfaces, cleaning, product evaporation | 5–80% (application-dependent) |
| Personnel | Respiration + perspiration; activity-dependent | 2–10% |
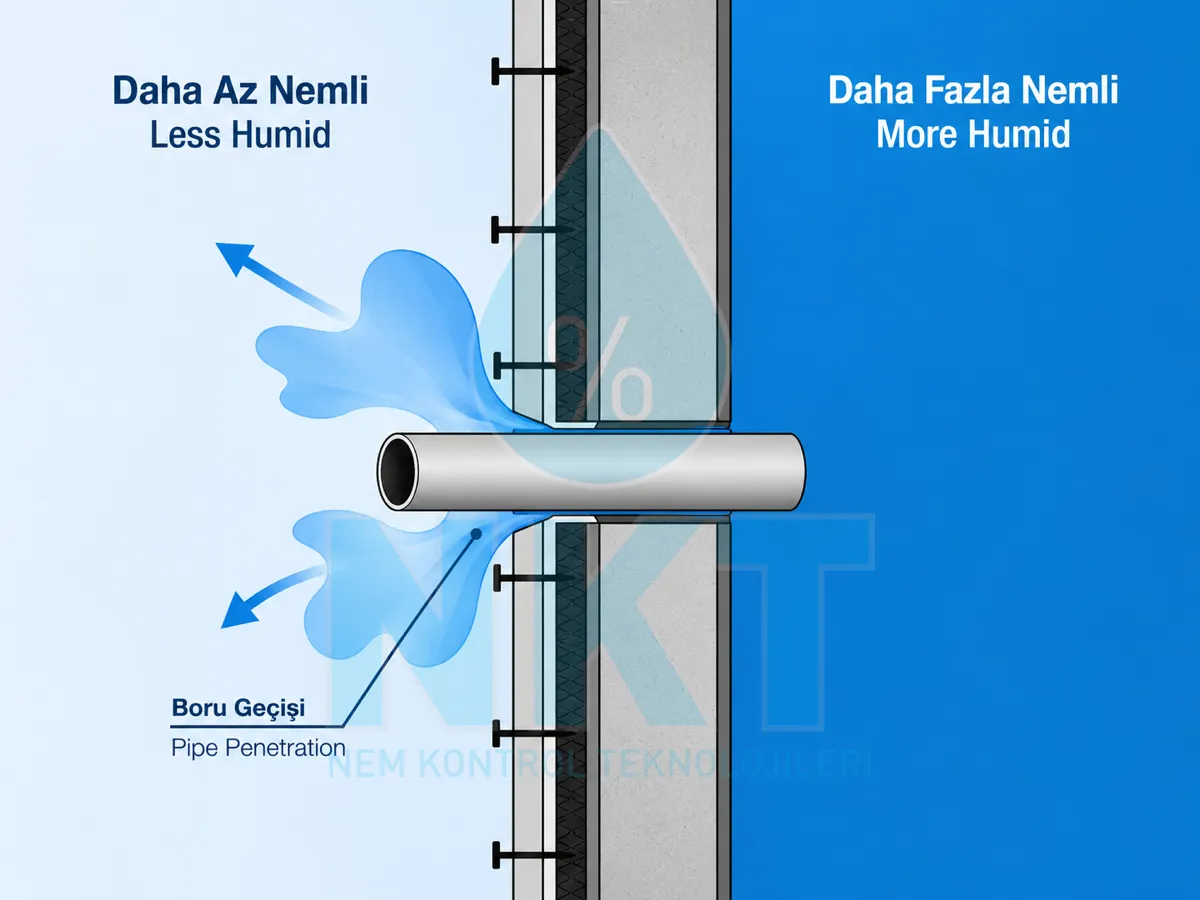
| Building diffusion | Slow vapour permeation through concrete, wood, plaster | 1–5% (20%+ in museum/archive) |
| Hygroscopic materials | Wood, paper, leather, cotton equilibrating with room RH | Transient (high in fresh stock) |
| Combustion emission | Internal-combustion engines, gas burners, open flame | 5–15% (warehouse/forklift) |
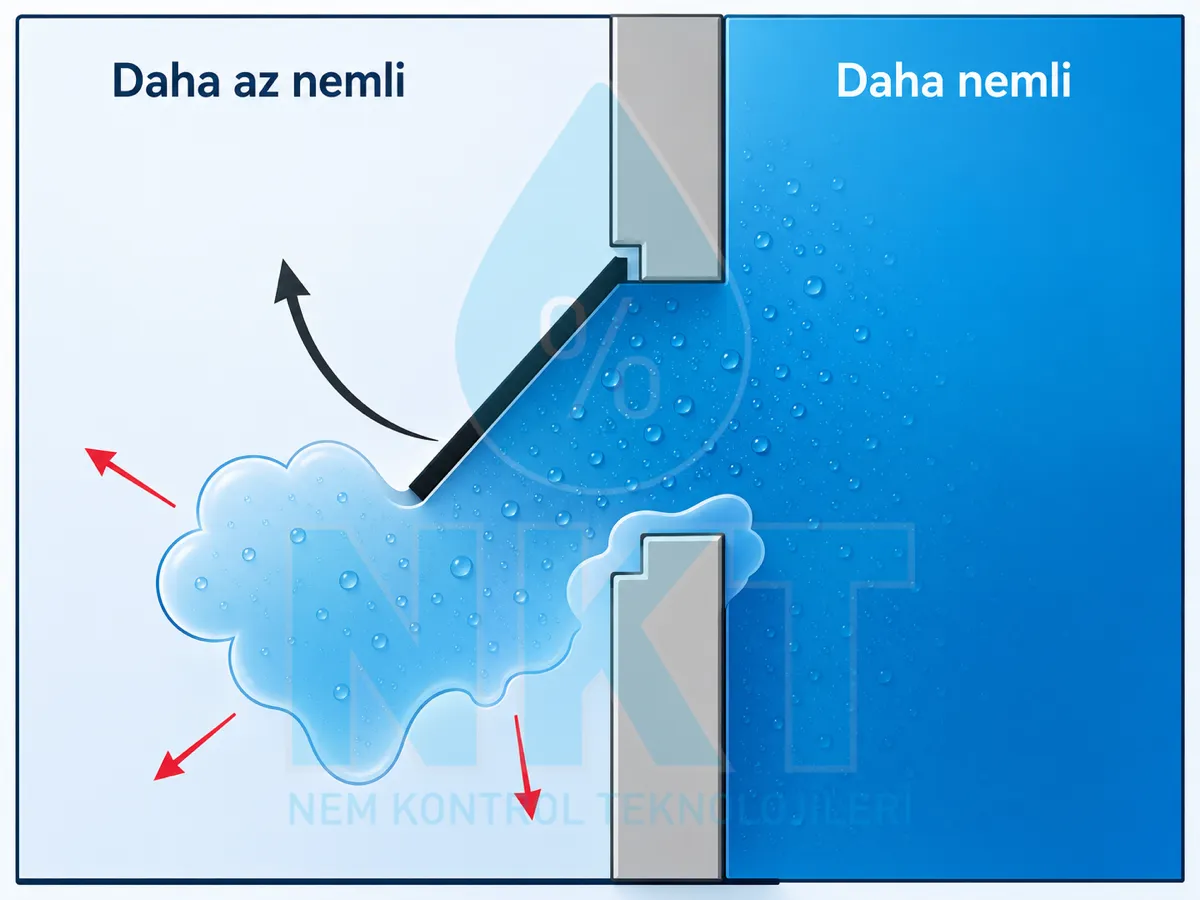
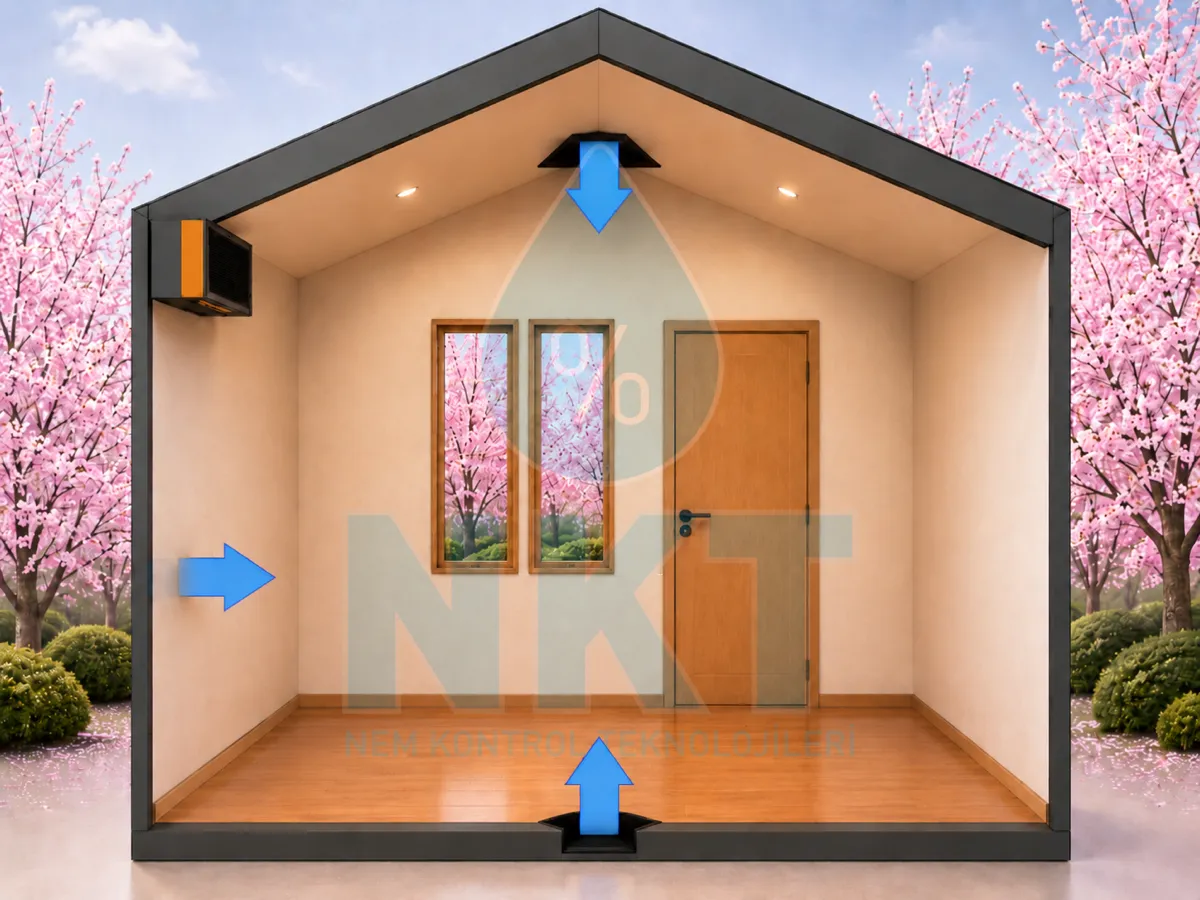
1) Unintended Ventilation (Infiltration)
In nearly every industrial space, infiltration is the single largest contributor to total moisture load. Building envelope leaks, door openings, conveyor openings and airlock crossings are the main pathways. Even in residential/office comfort applications, opening windows and exterior doors makes a major contribution.
General Formula
M = moisture load (g/h)
qv = leaking air flow rate (m³/h)
d = air density ≈ 1.2 kg/m³
x1 = outdoor air specific humidity (g/kg)
x2 = target room specific humidity (g/kg)
qv = room volume × air change rate (ACH)
Typical Air Changes per Hour by Volume (Tight Building)
| Room Volume (m³) | ACH Recommendation (1/h) | Notes |
|---|---|---|
| 0 – 500 | 0.3 | Residential, small office, basement: high S/V ratio, proportionally high infiltration |
| 500 – 1,000 | 0.25 | Mid-scale |
| 1,000 – 5,000 | 0.2 | Standard industrial warehouse |
| > 10,000 | 0.1 | Low S/V ratio, proportionally low infiltration |
These values apply to well-sealed buildings. For older buildings, multi-door facilities or porous construction materials, multiply by 2–3.
Door Opening Calculation
A = door opening area (m²)
S = airflow speed through open door ≈ 0.25 m/s (reference)
t = total door-open time per hour (minutes)
d = air density (kg/m³)
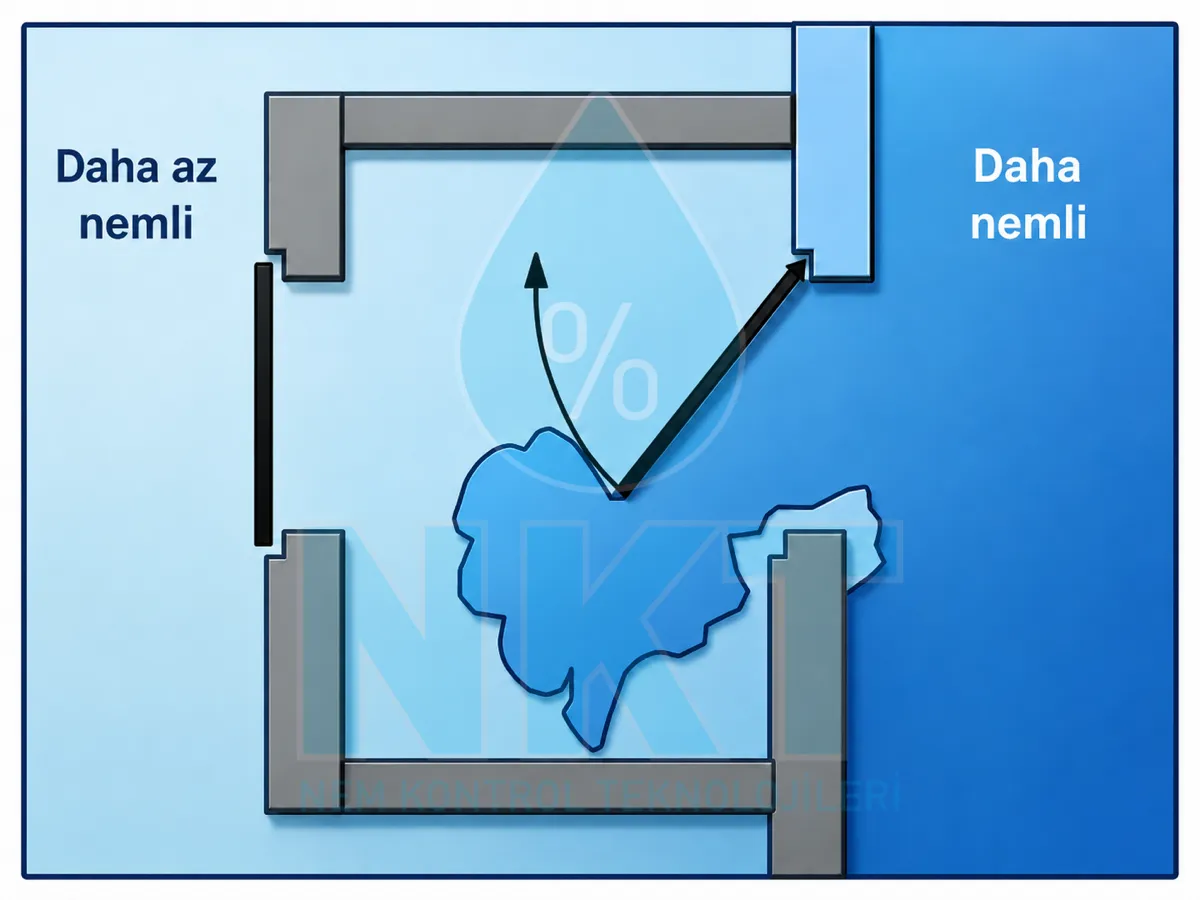
Airlock Calculation
h, l, w = airlock height, length, width (m)
f = hourly opening frequency
1/2 factor = assumption that airlock interior averages outdoor and indoor moisture
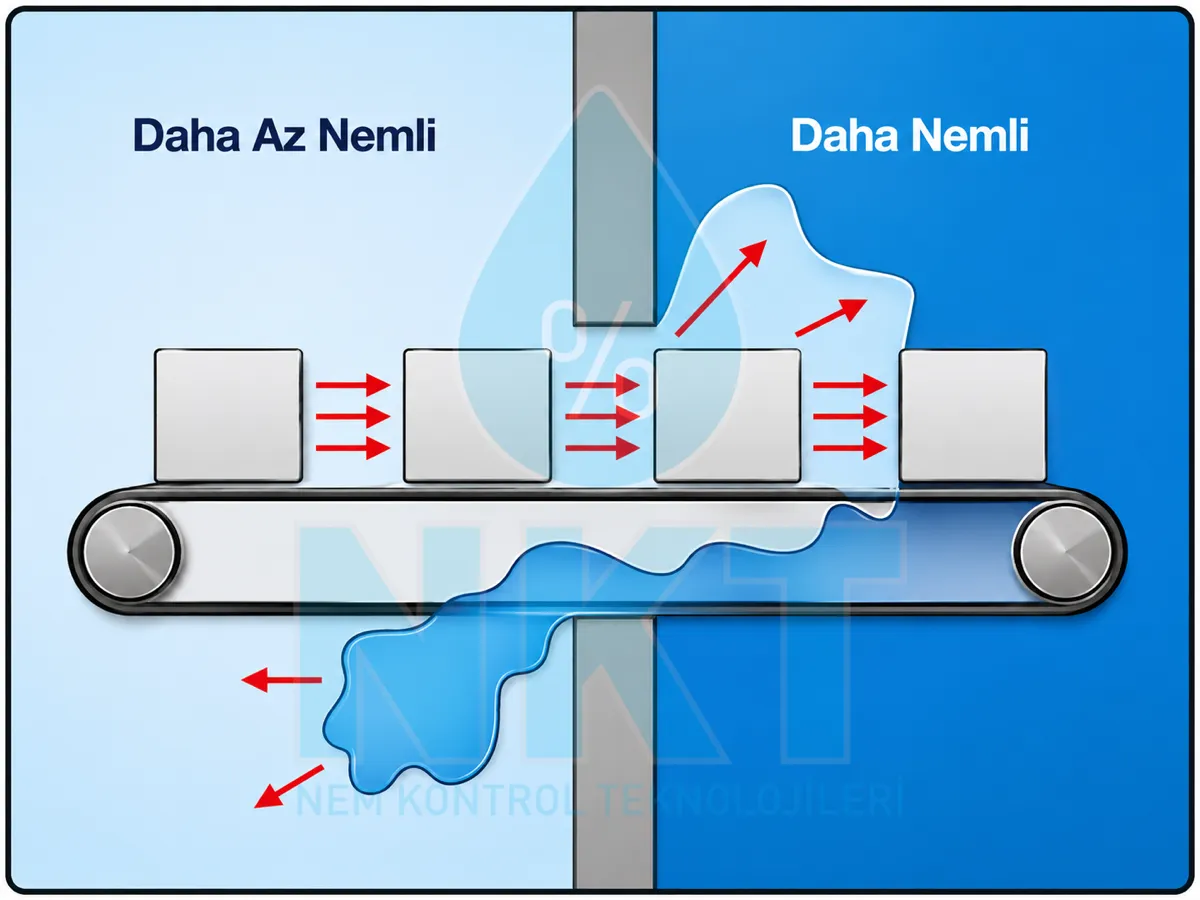
Conveyor Opening Calculation
V = conveyor velocity (m/s)
A = opening area (m²)
Worked Example: 600 m³ Room Infiltration
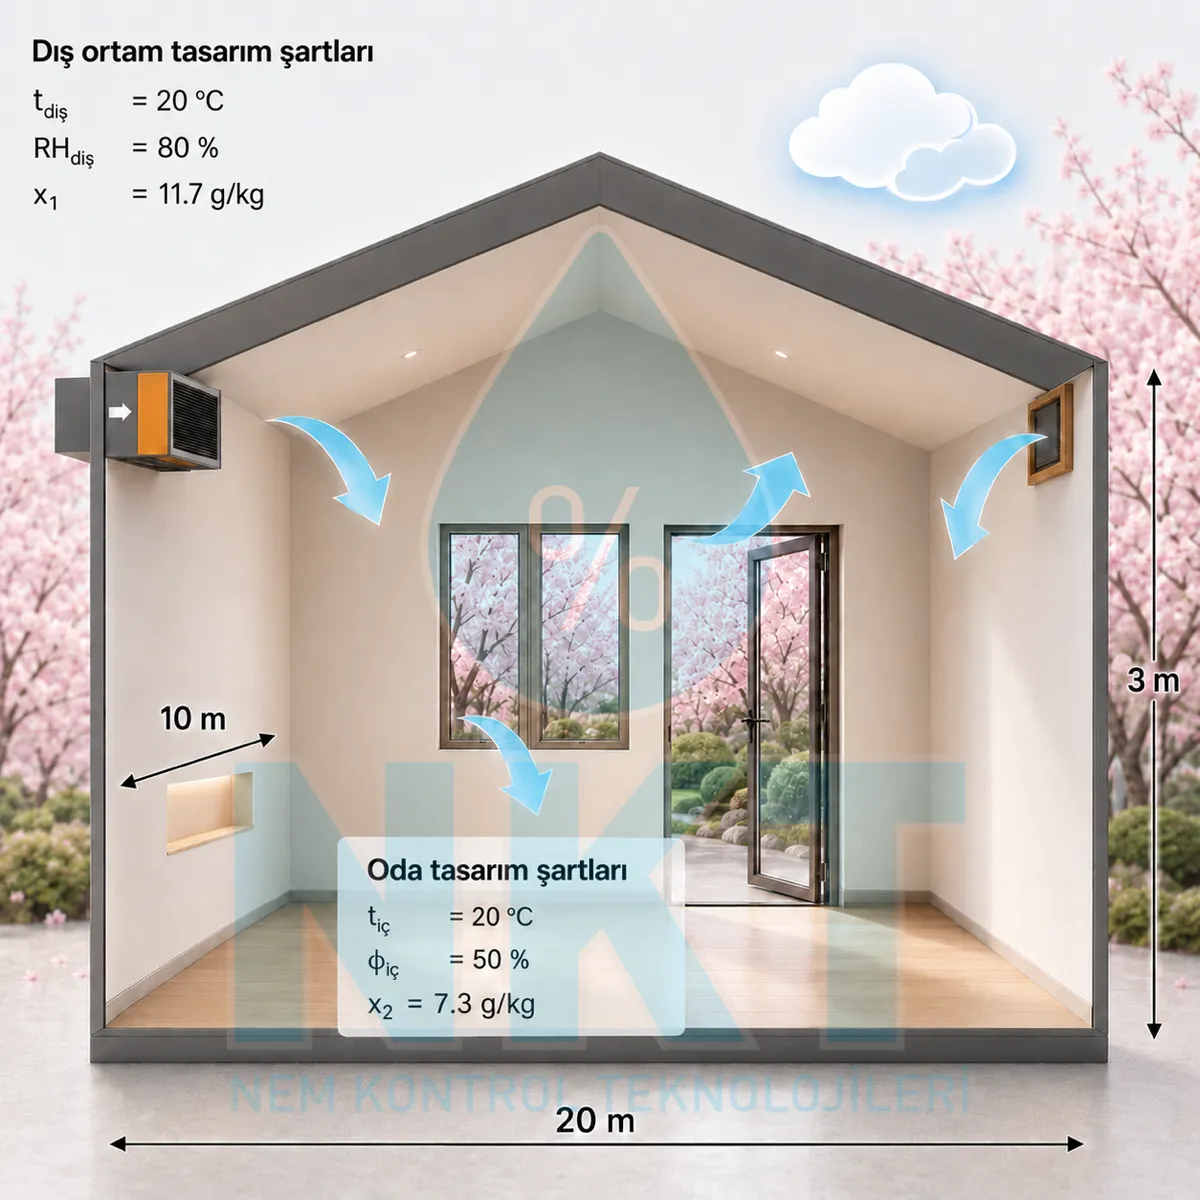
A production room of 20 m × 10 m × 3 m. Outdoor design condition 20°C, 80% RH (x₁ = 11.7 g/kg). Indoor target 20°C, 50% RH (x₂ = 7.3 g/kg).
Volume: 600 m³ → ACH = 0.25 (500–1,000 m³ band)
qv = 600 × 0.25 = 150 m³/h
M = 150 × 1.2 × (11.7 − 7.3) = 792 g/h
This is envelope infiltration only. Door, conveyor, and airlock openings must be calculated separately and added.
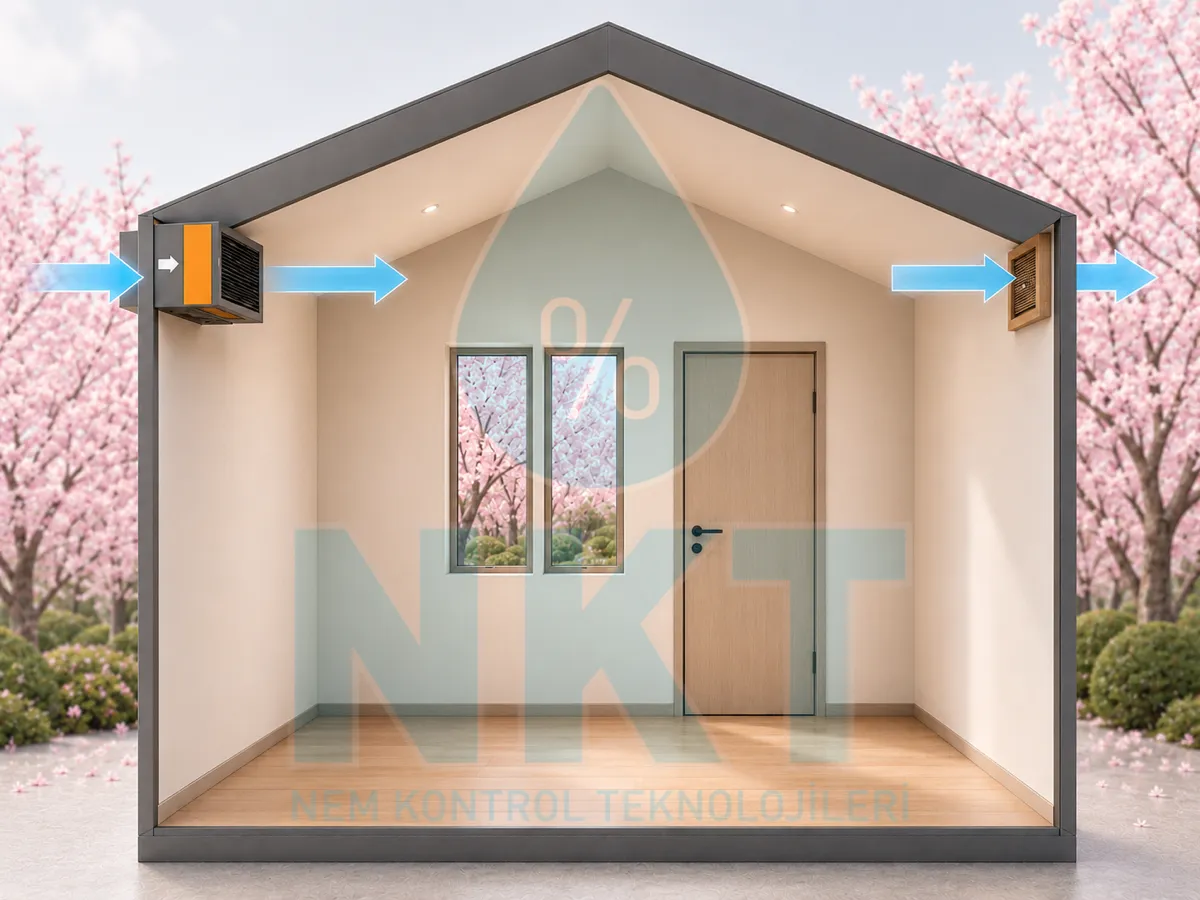
Infiltration Reduction Strategy: Positive Pressure
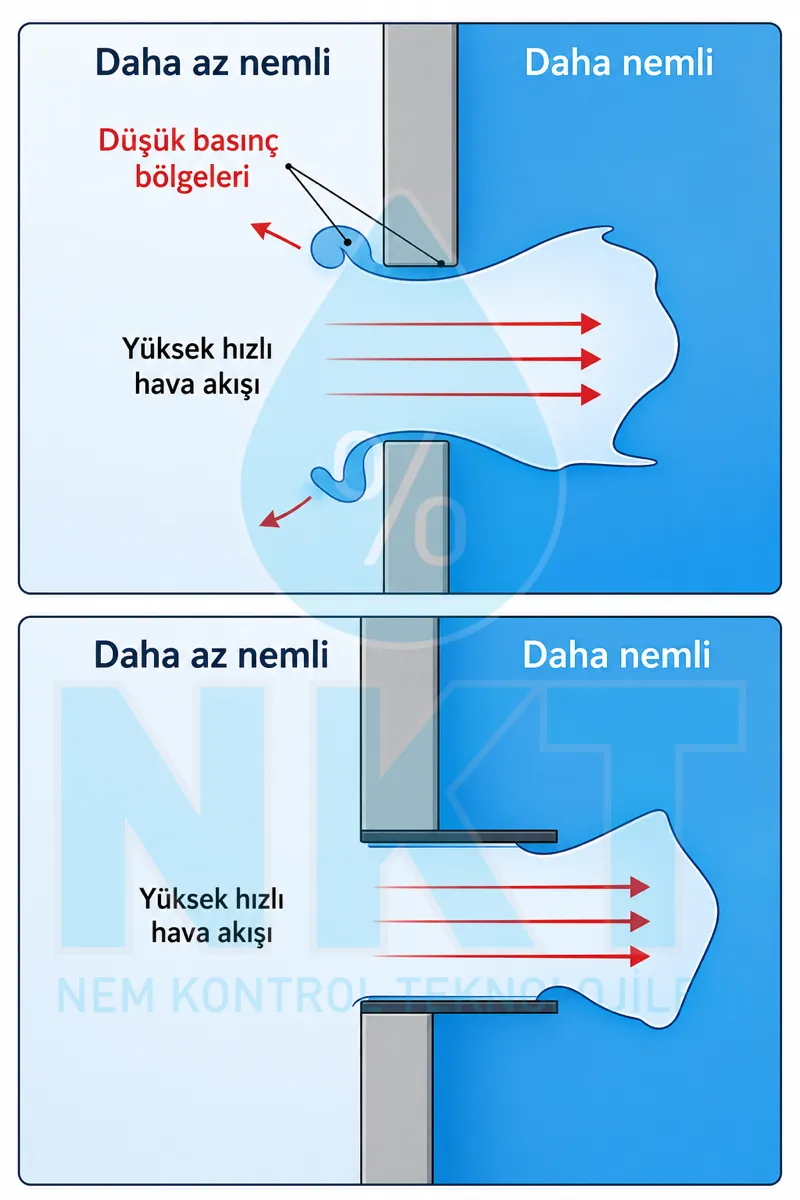
An effective way to greatly reduce infiltration through small openings is to maintain positive pressure inside the room. With at least 0.8 m/s outward air velocity through every opening, counter-flow moisture infiltration largely stops. Sustained effect requires that openings be ducted and low-pressure areas be moved away from the room.
2) Intentional Ventilation (Mechanical Supply)
Fresh air deliberately supplied for personnel health and process needs is a separate moisture load. ASHRAE 62.1 typically uses 25 m³/h per person of outdoor air.
In high-moisture-load applications (densely populated cleanrooms, for example), intentional ventilation can exceed infiltration. Using an Energy Recovery Ventilator (ERV/HRV) reduces this load by 50–70%.
3) Water Evaporation

Comes from open water surfaces, cleaning water, washing processes, cooling towers and product evaporation. Swimming pools, laundries and food processing facilities are places where this item dominates.
α = heat transfer coefficient (W/m²·°C)
Cp = specific heat of air = 1.005 kJ/kg·°C
A = water surface area (m²)
x1 = saturated air specific humidity above water surface
x2 = room specific humidity
The α coefficient is ~1.5 for still water surfaces and 1.5–6 for moving/agitated surfaces (circulating pools, jacuzzis). In swimming pools this item makes up 70–95% of total load; which is why pool-type dehumidifiers operate latent-load dominant and are built with corrosion-resistant casing.
4) Emission from Personnel
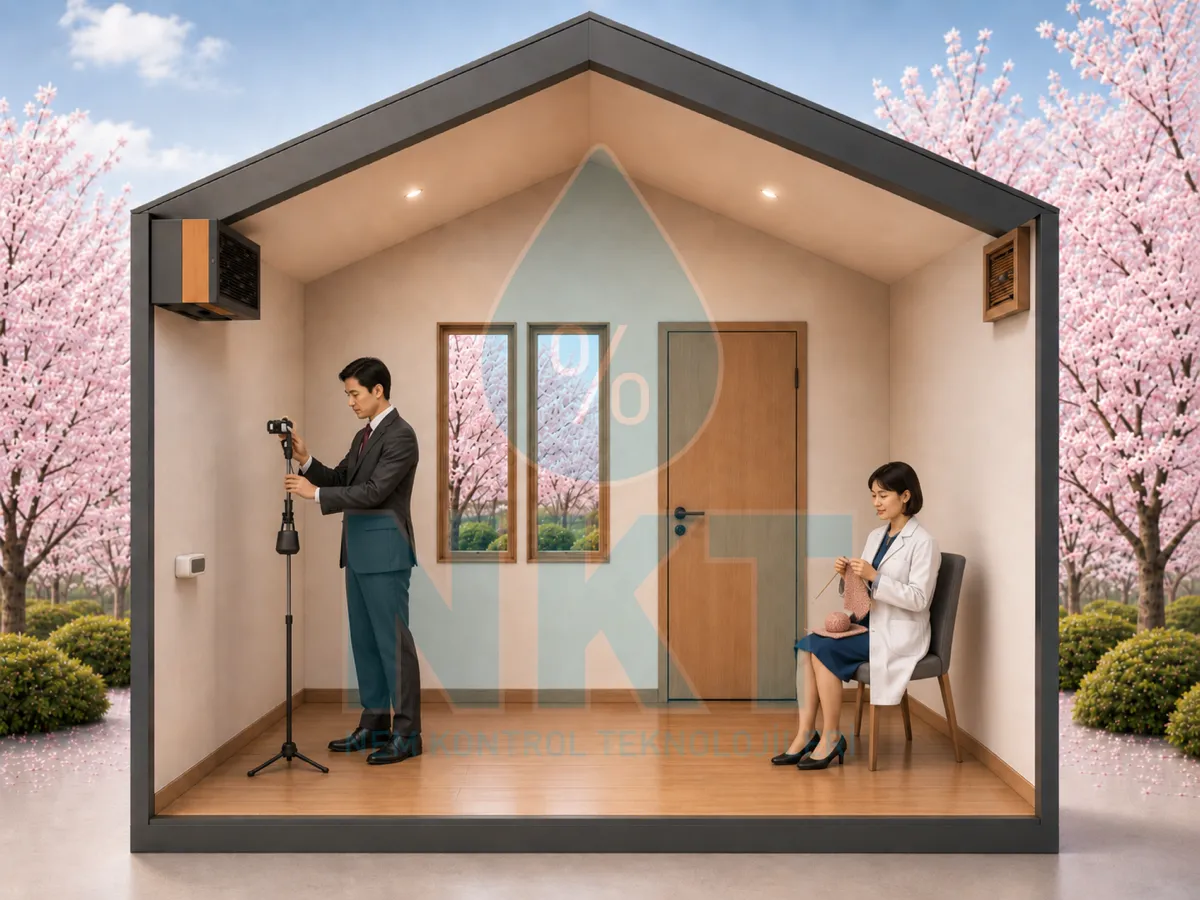
Through respiration and perspiration, people emit moisture at 20–25°C depending on activity level.
| Activity Level | Moisture Output (g/h/person) | Typical Scenario |
|---|---|---|
| Sedentary (desk work) | 60 | Office, monitoring room, control room |
| Medium activity | 125 | Light assembly, walking, light standing work |
| High activity | 200 | Heavy lifting, meat processing, dry-room rapid transit |
5) Diffusion through Building Materials
Under partial-pressure differences, water vapour slowly migrates through porous building materials such as concrete, plaster and wood.
cd = material diffusion coefficient (g/m·h·Pa)
A = wall surface area (m²)
wt = wall thickness (m)
Δp = vapour partial-pressure difference, indoor-to-outdoor (Pa)
In standard industrial HVAC designs this item is generally negligible (<5% of total load). However, in museum, archive, library, freeze-dryer storage and similar applications requiring long-term stability, it can be the dominant load source, the building envelope behaves like a large capacitive moisture buffer over time.
6) Evaporation from Hygroscopic Materials
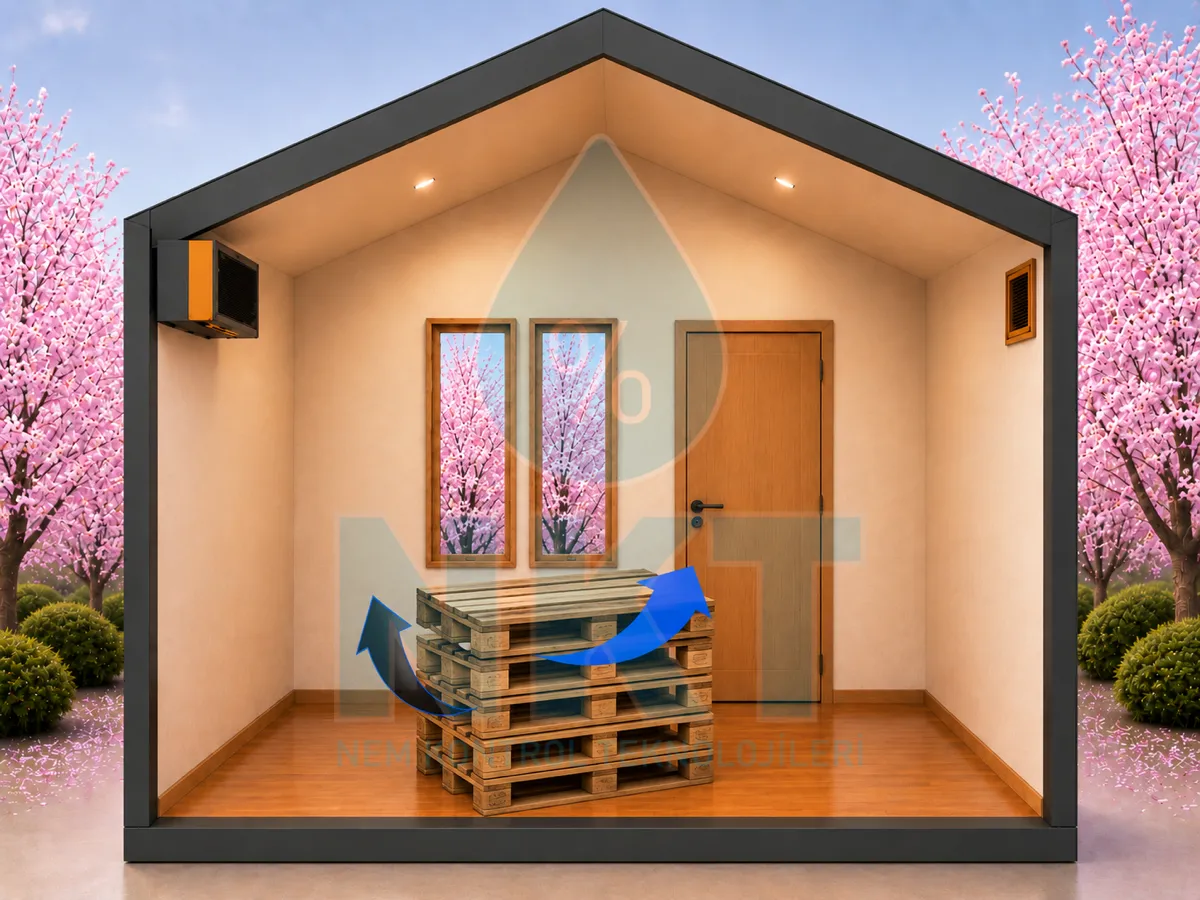
Hygroscopic materials such as wood, paper, leather, cotton and food products release moisture (high initial moisture) or absorb it (low initial moisture) until they reach equilibrium with the room's relative humidity. For freshly stocked products this item can be significant.
u1 = initial moisture content of material (g)
u2 = equilibrium moisture content at room RH (g)
t = time to equilibrium (h), depends on material and air circulation
Typical equilibrium moisture content (% of dry weight):
| Material | at 30% RH | at 60% RH | at 90% RH |
|---|---|---|---|
| Wood (softwood) | ~6% | ~11% | ~21% |
| Cotton | ~5% | ~9% | ~16% |
| Paper | ~5% | ~9% | ~17% |
| Leather | ~13% | ~21% | ~30% |
7) Emission from Combustion
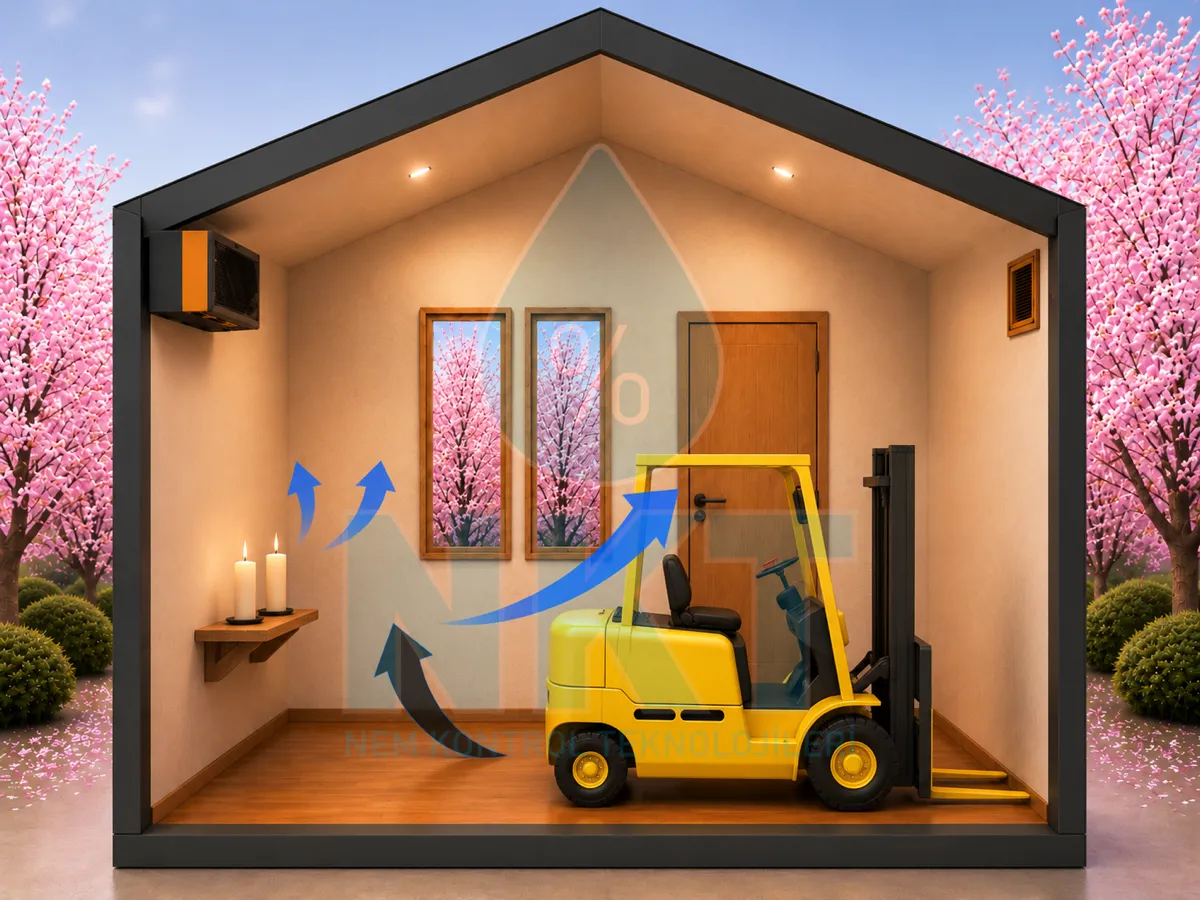
Internal-combustion engines (forklifts, generators), gas burners and direct-fired heaters produce water vapour as a combustion product.
For natural gas this ratio rises to ~2.2 kg/kg fuel (higher H/C ratio). Inadequate exhaust or equipment burning in enclosed spaces dumps this load directly into the indoor environment.
Total Load + Safety Factor
After the seven items are calculated separately, they are summed:
Mdesign = Mtotal × (1 + safety factor)
Safety factor = 0.15 – 0.25
Equipment Type Selection: Comfort or Process?
Once the design moisture load (g/h) is established, the question of which equipment type follows. The three most critical parameters in this decision are: target dew point, room temperature and annual operating hours.
| Target Dew Point | Recommended Technology | Typical Application |
|---|---|---|
| +12°Cdp ↔ +20°Cdp | Condensing type (CD/CDP series) | Home basement, office, retail, cold storage, food processing |
| −10°Cdp ↔ +12°Cdp | Condensing + pre-cooling or silica gel rotor | Freezer entry, mild process |
| −40°Cdp ↔ −10°Cdp | Silica gel rotor (AD series) | Pharma granulation, freeze-dryer storage |
| Below −40°Cdp | Multi-stage silica gel (ADP/ADE series) | Lithium battery dry rooms, gas analysis |
Comfort applications (home basement, office, retail, residential pool) are generally met with condensing type; there is a wide range from small portable models to wall-mounted or ducted industrial units. In process applications, the target dew point is the critical decision parameter.
Common Calculation Mistakes
- Underestimating infiltration, accounting only for the building envelope and forgetting door/conveyor/airlock openings. In cold storage applications this can omit more than 40% of the actual load.
- Using only summer or only winter extremes, dehumidifiers must be sized for summer peak, humidifiers for winter peak; calculating from one extreme alone undersizes both systems.
- Calculating in relative humidity, RH is temperature-dependent. Mass-balance equations require specific humidity (W). Calculating in RH introduces 20–30% error.
- Excessive safety factor, adding 50%+ leads to oversized equipment that short-cycles continuously, shortens compressor life and raises energy use. 15–25% is sufficient.
- Ignoring defrost-derived load, ice that builds up on cold storage evaporators releases water vapour to the atmosphere as it melts; this load is typically 10–20% of the total infiltration value.
NKT Engineering Solutions and Calculation Tools
An accurate moisture load calculation is done through software-supported, systematic analysis. The following free tools provide a practical starting point for both comfort and process applications:
- Psychrometric Calculator, relative humidity ↔ specific humidity ↔ dew point conversions
- Energy Efficiency Simulation, annual energy simulation comparing condensing vs silica gel rotor
- Pool Dehumidification Calculator, adiabatic evaporation calculation for swimming pool applications
- Industrial Dehumidification Calculator, automatic summation of all seven load items
For a detailed moisture load analysis and industrial dehumidifier selection, share your project via the contact form. The NKT, Humidity Control Technologies engineering team selects from TFT Italy's AD/ADP/ADE silica gel rotor and CD/CDP condensation dehumidifier series, providing project-specific analysis with ASHRAE Fundamentals and sector-specific reference values, plus a bin-hour energy simulation along with the equipment recommendation.
Related Glossary Terms
For deeper definitions of the technical concepts in this article, see the related pages in the NKT Glossary:


