Why Humidity Matters So Much
The moisture content of the air is a fundamental environmental parameter that profoundly affects our quality of life, health, and the longevity of the structures we inhabit. While most people focus on temperature, humidity is often treated as secondary; yet scientific research shows that improper humidity management can cause serious health and economic damage.
The World Health Organization (WHO) lists humidity control among the most critical factors affecting indoor air quality. Work by Sterling (1985) and later ASHRAE publications points to 40%–60% as the indoor relative humidity band where health risks are lowest. Deviating from this range in either direction produces serious consequences.
Humidity is not merely a matter of personal comfort. For critical facilities such as hospitals, pharmaceutical plants, museums, data centers, and food storage warehouses, humidity control is often required by standards and specifications as well as being an operational necessity. In this article, we will comprehensively examine every dimension of relative humidity, its effects on the human body, material and structural damage, energy costs, and economic consequences.
What Is Relative Humidity?
Definition and Units of Measurement
Relative humidity (RH) is the percentage of moisture actually present in the air compared to the maximum amount of moisture the air can hold at a given temperature (saturation point).
For example, at 25°C the air can hold approximately 23 g/m³ of water vapor. If the air contains 11.5 g/m³ of water vapor, the relative humidity reads 50%. The same amount of water vapor corresponds to roughly 38% RH at 30°C but can exceed 80% at 15°C. This relationship explains how heating and cooling systems directly affect humidity levels.
Absolute Humidity, Specific Humidity, and Dew Point
Absolute humidity refers to the mass of water vapor per unit volume of air (g/m³). Because the volume of air changes with temperature and pressure, this value is temperature-dependent. Specific humidity denotes the mass of water vapor per unit mass of dry air (g/kg) and is used in thermodynamic calculations. Dew point is the temperature at which water vapor in the air begins to condense when cooled. This value is critically important for assessing surface condensation risk.
Measurement Methods
| Method | Principle | Accuracy | Application |
|---|---|---|---|
| Capacitive Sensor | Capacitance change with humidity | ±2–3% RH | HVAC, building automation |
| Resistive Sensor | Conductivity change | ±3–5% RH | Industrial applications |
| Psychrometer | Dry-wet bulb temperature difference | ±1–2% RH | Reference measurements |
| Chilled Mirror | Reflection-based dew point | ±0.1°C DP | Laboratory, reference |
Sterling Chart: Comprehensive Risk Analysis
To visually illustrate the effects of relative humidity levels on human health, comfort, and the environment, a guideline was published in 1985 by Elia M. Sterling and colleagues (Criteria for human exposure to humidity in occupied buildings, ASHRAE Transactions); the chart was also reproduced in the 1986 review by Arundel et al. (Indirect health effects of relative humidity in indoor environments). The chart in this guideline shows the relative risk of parameters such as bacteria, viruses, mold, mites, respiratory diseases, allergic reactions, and chemical interactions across relative humidity values from 0% to 100%.
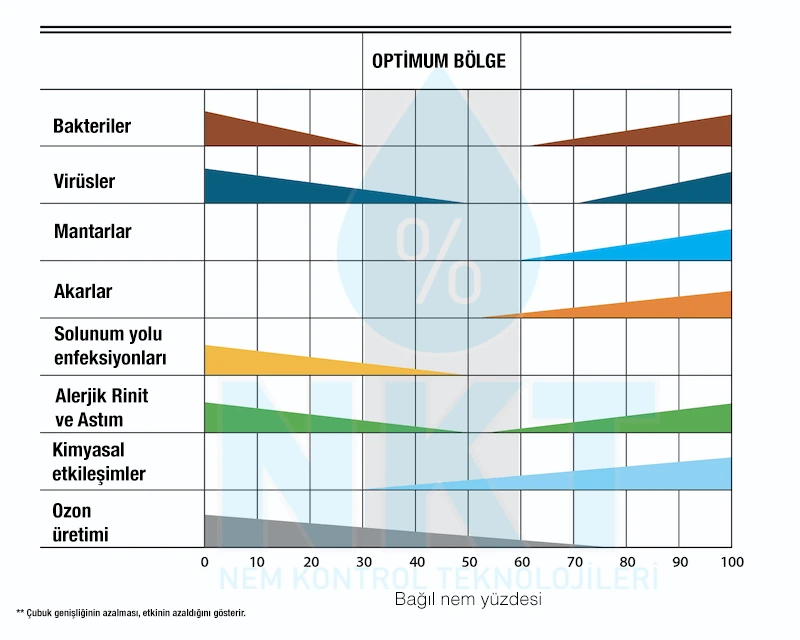
Sterling Chart: Distribution of biological and chemical risk factor severity by relative humidity level. Narrowing of the bar indicates decreasing effect.
Interpreting the Sterling Chart
- Bacteria: Risk increases at both very low (10%–25%) and very high (70%–90%) humidity levels. Bacterial growth is minimized in the optimal zone (40%–60%).
- Viruses: Low humidity (10%–30%) corresponds to the highest virus transmissibility. The influenza virus survives longest in this range.
- Mold and fungi: Risk begins to rise significantly above 60%; it becomes inevitable above 80%.
- House dust mites: They actively reproduce above 50%; explosive growth occurs between 70%–80%.
- Respiratory infections: Worsen at both extremes; at their lowest in the ideal 40%–60% window.
- Allergic rhinitis and asthma: Triggered by mucosal dryness at low humidity and increased allergens at high humidity.
- Chemical interactions: High humidity accelerates chemical reactions; corrosion and material degradation begin.
- Ozone production: The Sterling chart places ozone production at the low-humidity end; its effect decreases as humidity rises.
| Humidity Range | Primary Risk | Severity | Recommended Action |
|---|---|---|---|
| 10% – 20% | Virus transmission, static, skin damage | High | Immediate humidification |
| 20% – 30% | Respiratory irritation, ESD, wood damage | Medium-High | Increase humidity |
| 30% – 40% | Mild comfort issues, allergic threshold | Medium | Monitor and adjust |
| 40% – 60% | Minimum risk, optimal zone | Low | Maintain current conditions |
| 60% – 70% | Mold threshold, mite reproduction onset | Medium | Dehumidification systems |
| 70% – 80% | Active mold, heavy mites, condensation | High | Immediate dehumidification |
| 80%+ | Decay, severe mold, structural damage | Critical | Professional intervention |
Low Humidity (Below 30%): Detailed Effects
In heated indoor spaces during winter, air-conditioned offices, and cold climates, relative humidity can fall below 30%. This drop adversely affects everything from the respiratory system to skin health, electronic equipment to wooden furniture.
Effects on the Respiratory System
The respiratory tract mucosa requires moisture to expel harmful particles and pathogens. Under normal conditions, the mucus layer lining the upper respiratory tract is continuously moved by microscopic hair-like structures called cilia, clearing contaminants. This "mucociliary clearance" mechanism is severely impaired when relative humidity falls below 30%.
- Increased mucus viscosity: Low humidity thickens mucus and halts cilia movement; viruses and bacteria adhere to the mucosa and cause infection.
- Increased viral survival: The influenza virus survives longest in the 20%–30% humidity range. Low humidity extends the time virus particles remain airborne.
- Worsening of asthma and COPD: Dry air irritates bronchial mucosa, triggering bronchospasm episodes.
- Nosocomial infections: Low humidity in hospitals increases the rate at which infectious diseases spread.
Skin and Mucosal Integrity
As the body's largest organ, the skin is in constant contact with the external environment. When relative humidity falls below 30%, transepidermal water loss (TEWL) increases, causing the skin to dry and crack. The keratin barrier breaks down; bacteria and allergens penetrate the skin. Eczema (atopic dermatitis) symptoms intensify, with increased itching and redness. Wound healing slows; risk increases for surgical patients.
Eye Health: Dry Eye Syndrome
The eye surface is protected by a three-layer tear film that is renewed with each blink. Low humidity specifically increases the evaporation rate of the aqueous layer, disrupting tear film balance. This effect is compounded in people who spend extended periods looking at computer screens. Symptoms include burning, stinging, blurred vision, redness, and light sensitivity.
Static Electricity and ESD Risks
Air is a medium with low electrical conductivity; humidity enables static charges that accumulate on surfaces to dissipate. When relative humidity drops below 30%:
- Up to 20,000 V of static charge can accumulate on carpet or fabric surfaces.
- Electrostatic discharge (ESD) can permanently damage semiconductor components and data storage devices.
- In environments with explosive dust or gas, static sparks can cause fires and explosions.
Material and Structural Damage
Wood materials have a hygroscopic structure that seeks equilibrium with ambient humidity. In low-humidity environments, wood loses moisture, shrinks, cracks, and loses its shape. Paper and archival materials become brittle with moisture loss. Textile products experience increased fiber fragility and reduced mechanical strength in low humidity.
Impact on Energy Systems
In low-humidity environments, people feel colder because their body surface dries faster. This can lead to thermostats being set to higher temperatures and to higher heating energy consumption.
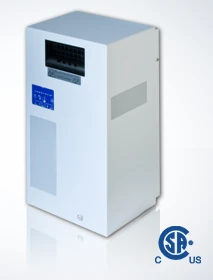
Low Humidity Solution: Humidification Systems
High Humidity (Above 60%): Detailed Effects
High humidity causes more widespread and multifaceted damage than low humidity. It poses a persistent problem particularly for coastal settlements, rainy climates, basements, and enclosed swimming pools.
Mold and Fungal Growth
Mold spores are found everywhere in the natural environment; however, they require suitable conditions to reproduce. When relative humidity exceeds 60% and surface moisture is high, growth begins rapidly. At 80% and above, severe mold problems become inevitable.
- Mycotoxins: Mold species such as Aspergillus, Stachybotrys, and Penicillium produce mycotoxins that, with long-term exposure, cause liver damage, neurotoxicity, and immune system suppression.
- Allergic reactions: Mold spores trigger allergic symptoms including asthma, rhinitis, urticaria, and conjunctivitis.
- Childhood asthma development: Epidemiological studies support that early mold exposure increases asthma risk in children.
House Dust Mites
House dust mites (Dermatophagoides pteronyssinus and D. farinae) reproduce fastest in the 70%–80% humidity range. It has been proven that mite populations significantly decrease when humidity is reduced below 50%. The Der p1 and Der p2 proteins in mite feces are among the most important triggers of allergic asthma.
Structural Damage
- Condensation: Water condenses on cold surfaces; it reduces the thermal resistance of insulation materials.
- Corrosion: Metal surfaces rust rapidly; electrical connections are damaged.
- Wood decay: Wood begins biological decay above 20% moisture content.
- Insulation performance loss: Wet insulation materials lose up to 70% of their thermal resistance.
- Paint and plaster damage: Blistering, cracking, and peeling occur.
Food Safety
In food storage and processing facilities, high humidity causes mold formation, bacterial growth, and moisture-related cross-contamination. The recommended relative humidity for grain storage is 55%–65%; at higher humidity mold risk increases and conditions can become favorable for aflatoxin-producing Aspergillus flavus.
Energy Inefficiency
Cooling systems also have to remove moisture from the air while cooling it. High external humidity increases the latent heat load on cooling systems and significantly raises energy consumption.
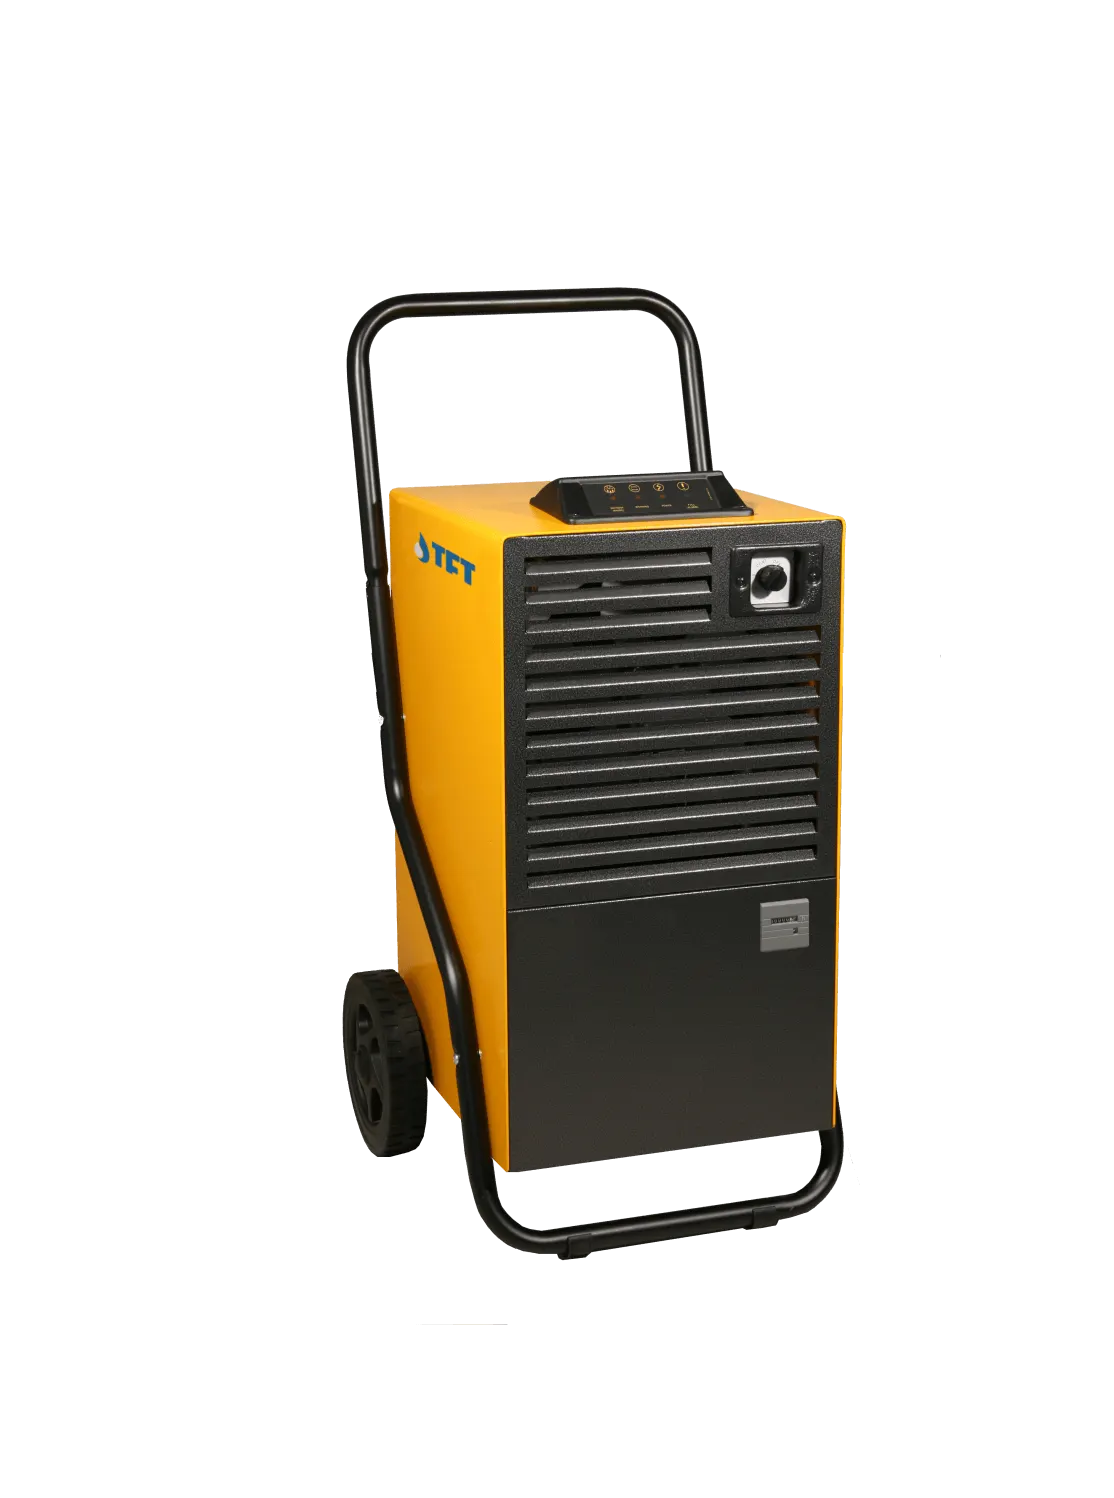
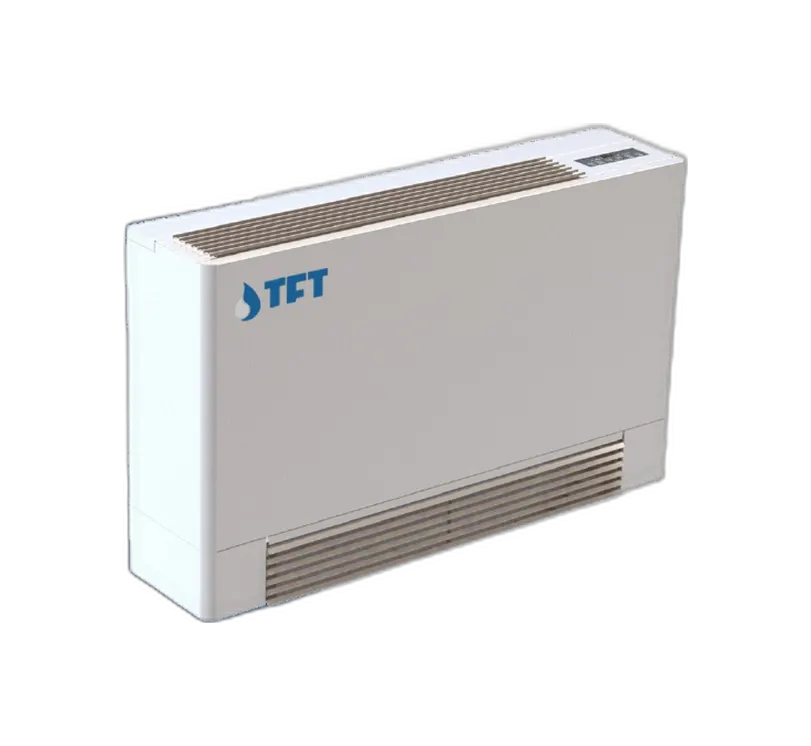
High Humidity Solution: Dehumidifiers
Ideal Range: 40%–60%
ASHRAE Standard 55 sets no lower relative humidity limit for thermal comfort and gives its upper limit as a humidity ratio of 0.012 kg/kg (≈ 12 g/kg); ISO 7730 recommends 30%–70%. For health and hygiene the optimal window is generally taken as 40%–60%. Within this range:
- The mucociliary clearance mechanism operates at full capacity.
- Virus and bacteria transmissibility is at its lowest level.
- The surface moisture required for mold spore germination does not form.
- House dust mite populations are kept suppressed.
- Static electricity buildup is negligible.
- The dimensional stability of wood, paper, and textile materials is maintained.
- People experience thermal comfort with the lowest heating/cooling energy expenditure.
Effects of Humidity on the Human Body
Humidity Standards for Special Environments
Different application areas bring their own humidity requirements and regulatory frameworks:
| Environment | Recommended RH Range | Rationale | Relevant Standard / Note |
|---|---|---|---|
| Hospital Operating Room | 45%–55% | ESD prevention, infection control | ASHRAE 170 (permitted 20%–60%) |
| Intensive Care Unit | 40%–60% | Respiratory comfort, bacterial control | ASHRAE 170 |
| Pharmaceutical Manufacturing | 40%–50% | Hygroscopic raw material stability | Product/process specification (GMP) |
| Archive, Library and Museum | 45%–55% | Dimensional stability of artefacts | ISO 11799, BS 4971 (archives and libraries) |
| Data Center | 40%–60% | ESD and condensation prevention | ASHRAE TC 9.9 (class A1; recommended envelope defined by dew point and max. 60% RH), ISO/IEC 22237 |
| Textile Manufacturing | 55%–70% | Fibre elasticity, static prevention | Process specification (ISO 139 is only the test atmosphere: 20°C/65%) |
| Grain Storage | 55%–65% | Mold and aflatoxin prevention | FAO guidelines |
| Electronics Manufacturing | 40%–55% | ESD prevention, solder quality | IPC-A-610, JEDEC |
| Indoor Swimming Pool | 50%–60% | Corrosion, comfort, condensation prevention | ASHRAE 62.1, VDI 2089 |
Humidity Control Methods and Equipment
Humidification Systems (Low Humidity Solution)
- Resistive Steam Humidifier, Recommended: Water in a stainless-steel steam tank is boiled by heating elements to produce steam. The steam tank can be opened and cleaned without tools, which makes maintenance easy and fast. Safely preferred in food, pharmaceutical, museum, and office applications.
- Evaporative Humidifier, Recommended: Air gains moisture through adiabatic evaporation by passing through humidifying media. Energy consumption is very low. Provides a cost-effective solution for large-volume industrial spaces.
- Ultrasonic Humidifier, Caution Required: While relatively low energy consumption may seem advantageous, the cold mist produced disperses minerals and pathogens in the air into the environment. Not recommended for industrial facilities and the food/pharmaceutical sector.
Dehumidification Systems (High Humidity Solution)
- Condensation Dehumidifier: Air is directed against a cold coil to condense moisture. Efficient in warm environments (>15°C). Wide application range from residential to industrial. The CDNP portable series provides effective humidity control for emergency response and construction sites; the Microwell DRY WAVE series for indoor pools.
- Silica Gel Rotor (Desiccant) Dehumidifier: Hygroscopic material absorbs moisture; operates continuously with a regeneration cycle. Superior at low temperatures and for very low humidity targets. Preferred in cold storage, pharmaceutical plants, and lithium battery facilities.
Integrated HVAC Solutions
In modern buildings, humidity control is typically managed in an integrated manner with heating, ventilation, and air conditioning (HVAC) systems. Variable air volume (VAV) systems, energy recovery ventilation units (HRV/ERV), and smart automation systems optimize humidity management.
Humidity Monitoring Systems
Continuous monitoring is essential for effective humidity management. Modern humidity monitoring systems consist of the following components:
- Sensor Network: Wireless or wired temperature-humidity sensors placed at strategic locations.
- Data Logger: Devices that record measurement data with timestamps.
- Cloud-Based Monitoring Platform: Real-time visualization, alarm management, and remote access.
- Alarm System: SMS/email/app notifications when humidity thresholds are exceeded.
- SCADA/BMS Integration: Automation and control integrated with building management systems.
Cost Analysis: The Price of Uncontrolled Humidity
| Risk Category | High Humidity Cost | Low Humidity Cost |
|---|---|---|
| Healthcare expenses | Mould-related respiratory complaints, absenteeism | More respiratory infections in winter |
| Building repair | Mould remediation and surface repair | Cracking and repair of timber |
| Additional energy cost | Higher latent cooling load | Raised heating setpoint for comfort |
| Product/material loss | Food spoilage, moldy products | ESD damage, brittle materials |
| Insurance premiums | Water/moisture damage coverage | Fire (ESD) risk premium |
Humidity Comfort Simulator
Your indoor humidity is ideal. This protects your health and reduces your risk of airborne infection.
Calculations use the Magnus equation and psychrometric formulas. Absolute humidity is in g/kg dry air (SI). Comfort assessment is based on ASHRAE 55 (20–26°C, max. 12 g/kg), the Humidex heat-stress scale and the Sterling Chart.
References
- ASHRAE. (2022). Standard 55: Thermal Environmental Conditions for Human Occupancy. Atlanta: ASHRAE.
- Sterling, E. (1985). Criteria for human exposure to humidity in occupied buildings. ASHRAE Transactions, 91(1B), 611–622.
- Baughman, A. V., & Arens, E. A. (1996). Indoor humidity and human health. ASHRAE Transactions, 102(1), 193–211.
- Lowen, A. C., et al. (2007). Influenza virus transmission is dependent on relative humidity and temperature. PLOS Pathogens, 3(10), e151.
- Noti, J. D., et al. (2013). High humidity leads to loss of infectious influenza virus from simulated coughs. PLOS ONE, 8(2), e57485.
- Marr, L. C., et al. (2019). Mechanistic insights into the effect of humidity on airborne influenza virus survival. Journal of the Royal Society Interface, 16(150).
- WHO. (2009). WHO Guidelines for Indoor Air Quality: Dampness and Mould. Copenhagen: WHO Regional Office for Europe.
- ISO 11799:2015. Information and Documentation, Document Storage Requirements for Archive and Library Materials.